

-
得不到及时有效治疗的肺炎病人演变为重症肺炎的风险将会提高,可能会引起严重并发症,严重影响病人的生活质量甚至危及病人生命[1],因此评估肺炎的严重程度并提供适当的治疗具有重要的临床意义和社会经济效益。肺炎严重指数评分系统已被用来评估肺炎病人是否可以作为门诊病人或住院病人治疗,CURB-65评分系统亦是预测肺炎严重程度的重要工具[2],然而,这些评分系统需要费时耗力去收集病人的多项数据,因此各种生物标志物被研究以便于评估肺炎的严重程度。目前中性粒细胞(N)与淋巴细胞(L)比值(NLR)是肺炎中研究最多的标志物之一,已被证明是肺炎预后、风险分层的重要标志物[3-4],同时NLR亦被证明与肺炎严重程度相关[5],然而单项标志物诊断肺炎的ROC曲线下面积相对较小,因此组合多种标志物联合评估可能会提供更多的诊断信息。
肿瘤特异性生长因子(TSGF)在口腔癌、直肠癌、胃癌、乳腺癌中被证明是重要的预测指标[6-9]。然而TSGF并不是恶性肿瘤特异性标志物,在非恶性肿瘤疾病中也有较高的阳性率[10],有文献[11-12]报道炎症细胞分泌非特异性血管生长因子,可以使血清中TSGF升高,非恶性肿瘤病人的TSGF升高可能是由于炎症所致,炎症消失后TSGF逐渐下降。已有研究[13-14]证明TSGF升高在非恶性肿瘤疾病如机械性损伤及淋巴结反应性增生中与炎症反应相关,然而TSGF在肺炎严重程度评估中的应用鲜见国内外文献报道。因此,本研究拟探讨TSGF在肺炎严重程度评估中的应用并与其他已知标志物进行比较。现作报道。
-
连续收集2018年1月至2019年4月安徽省第二人民医院呼吸内科收治确诊的肺炎病人79例(肺炎组),排除合并恶性肿瘤、其他慢性疾病、感染性或炎性疾病、系统性自身免疫性疾病、心血管和代谢疾病者。按CURB-65评分[15]将肺炎组分成低危肺炎组42例(CURB-65评分为0~1分)和中高危肺炎组37例(CURB-65评分为2~5分)。正常对照组来源于健康体检中心体检合格的健康体检者40名,体检报告显示肺功能正常,无任何呼吸系统疾病、慢性疾病、感染性疾病、炎性疾病、恶性肿瘤、系统性自身免疫性疾病及其他重要脏器疾病。被纳入本研究对象本人或家属签署知情同意书,本研究符合医院伦理委员会要求并通过审批。
-
试剂盒TSGF购自湖南新大陆生物技术有限公司;超敏C反应蛋白(hs-CRP)购自美康生物科技股份有限公司;纤维蛋白原(FIB)和CS-5100型全自动凝血分析仪、CBC试剂盒和XN-1001型全自动血细胞分析仪购自日本希森美康株式会社;CTK120型离心机购自湖南湘仪实验室仪器开发有限公司;HITACHI LABOSPECT 008AS型全自动生化分析仪购自日本日立公司。
-
按照各项检测指标要求采集全血于各试管中待检测,所有的操作均严格按照仪器标准操作规程、试剂说明书所规定的要求进行。
-
采用χ2检验、Fisher确切概率法、t检验、方差分析及q检验;ROC曲线AUC之间比较用Z检验;采用Pearson相关性分析、Spearman相关性分析及logistic回归分析。
-
除年龄和性别外,其他指标2组差异均有统计学意义(P < 0.05),与正常对照组比较,TSGF、FIB、hs-CRP、N、NLR在肺炎病人中呈上升趋势,而L呈下降趋势(P < 0.01)(见表 1)。
分组 n 男 年龄/岁 TSGF/(U/mL) FIB/(g/L) hs-CRP/(mg/L) N/(109/L) L/(109/L) NLR 正常对照组 40 25 75.9±8.7 29.6±7.7 2.9±0.9 1.8±3.9 3.7±1.3 2.2±0.7 1.8±0.7 肺炎组 79 45 76.8±8.6 64.9±10.5 4.2±1.6 34.4±21.6 6.9±4.7 1.2±0.7 8.4±8.3 t — 0.34# 0.54 18.84 4.76 9.45 4.22 7.36 5.01 P — >0.05 >0.05 < 0.01 < 0.01 < 0.01 < 0.01 < 0.01 < 0.01 #示χ2值 表 1 肺炎组病人与正常对照组特征及实验室指标结果比较(x±s)
-
除性别和年龄外,其他参数在3组之间的差异均有统计学意义(P < 0.01),TSGF、FIB、hs-CRP、NLR、N在低危肺炎组和中高危肺炎组中呈上升趋势,而L呈下降趋势;TSGF、hs-CRP、N、L、NLR在低危肺炎组和中高危肺炎组之间的差异均有统计学意义(P < 0.05)(见表 2)。
分组 n 男 年龄/岁 TSGF/(U/mL) FIB/(g/L) hs-CRP/(mg/L) N/(109/L) L/(109/L) NLR 正常对照组 40 25 75.9±8.7 29.6±7.7 2.9±0.9 1.8±3.9 3.7±1.3 2.2±0.7 1.8±0.7 低危肺炎组 42 21 76.1±7.7 60.0±9.2* 4.0±1.6* 27.8±21.7* 5.2±3.9 1.4±0.6* 5.1±6.2* 中高危肺炎组 37 24 77.5±9.6 70.5±9.2*# 4.5±1.5* 42.0±19.1*# 8.8±4.9*# 1.0±0.6*# 12.2±8.9*# F — 2.13# 0.39 231.82 13.91 56.67 19.58 36.96 28.14 P — >0.05 >0.05 < 0.01 < 0.01 < 0.01 < 0.01 < 0.01 < 0.01 MS组内 — — 75.005 76.117 1.875 284.766 13.396 0.404 38.333 #示χ2值;两两比较:与正常对照组比较*P < 0.05;与低危肺炎组比较#P < 0.05 表 2 低危肺炎组和中高危肺炎组病人及正常对照组临床资料及实验室指标结果比较(x±s)
-
ROC曲线见图 1,TSGF的AUC大小依次为hs-CRP、NLR、FIB,且TSGF与hs-CRP、NLR、FIB的AUC之间差异均有统计学意义(P < 0.01)(见表 3)。

图 1 4项标志物诊断肺炎的ROC曲线
炎症标志物 AUC SE P 95%CI hs-CRP 0.924 0.023 < 0.01 0.861~0.965 TSGF 0.995 0.004 < 0.01 0.960~1.000 NLR 0.864 0.032 < 0.01 0.789~0.920 FIB 0.758 0.045 < 0.01 0.671~0.832 表 3 4项标志物诊断肺炎的ROC的AUC分析结果
-
对实验室指标与肺炎病人CURB-65评分进行双变量Spearman相关性分析,除L与CURB-65评分呈负相关(P < 0.01),TSGF、FIB、hs-CRP、N、NLR与CURB-65评分呈正相关(P < 0.05~P < 0.01)(见表 4)。
指标 FIB TSGF N L NLR hs-CRP rs 0.234 0.543 0.460 -0.371 0.516 0.364 P < 0.05 < 0.01 < 0.01 < 0.01 < 0.01 < 0.01 表 4 6项指标与肺炎病人CURB-65评分相关性分析(rs)
-
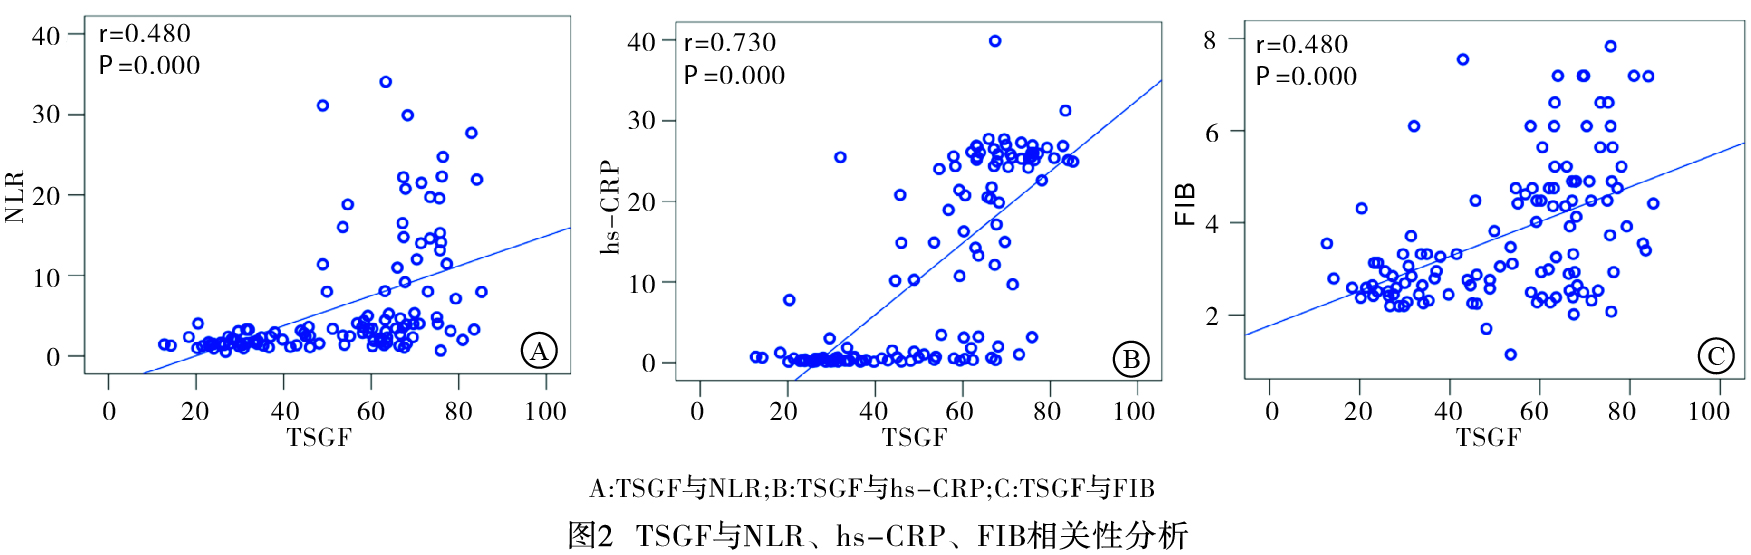
对TSGF与NLR、hs-CRP、FIB线性相关性分析采用双变量Pearson相关性分析,TSGF与NLR、hs-CRP、FIB均成正相关(P < 0.05)(见图 2)。

图 2 TSGF与NLR、hs-CRP、FIB相关性分析
-
以是肺炎是否严重为因变量,定义低危肺炎状态变量为0,中高危肺炎状态变量为1,以TSGF、NLR、hs-CRP、FIB、N、L、年龄、性别等指标为自变量进行多因素logistic回归模型分析,结果显示高TSGF为肺炎严重独立危险因素(P < 0.01)(见表 5)。
指标 B Waldχ2 OR 95%CI P TSGF 0.192 10.393 1.211 1.078~1.361 < 0.01 NLR -0.005 0.004 0.995 0.838~1.181 >0.05 hs-CRP -0.021 0.690 0.979 0.931~1.029 >0.05 FIB 0.073 0.071 1.076 0.629~1.838 >0.05 N 0.260 3.633 1.297 0.993~1.694 >0.05 L -0.894 1.556 0.409 0.100~1.666 >0.05 年龄 -0.692 2.935 0.912 0.820~1.013 >0.05 性别 -0.081 0.014 0.922 0.243~3.503 >0.05 表 5 肺炎严重危险因素多因素logistic回归模型分析
-
我们的研究结果显示,低危和中高危肺炎病人TSGF、FIB、hs-CRP、NLR均高于正常对照组,L均低于正常对照组,而N在低危肺炎组和正常对照组之间差异无统计学意义。与低危肺炎病人相比,中高危肺炎病人中TSGF、hs-CRP、NLR、N水平显著升高,L显著下降。在诊断肺炎的ROC曲线中,TSGF的AUC最大。此外,TSGF与FIB、NLR、hs-CRP及CURB-65评分均呈正相关,TSGF为肺炎严重独立危险因素。
肺炎的严重程度取决于局部炎症程度、肺部炎症的播散以及全身炎症反应程度,许多炎症标志物在肺炎病人诊断、严重程度评估、预后评估中已经被研究过,目前研究较多的是NLR、hs-CRP、FIB。NLR已被证明是一种有效的全身炎症测量方法[16],据报道NLR可能是肺炎病人炎症的替代标志物[17-18],此外NLR已被证明是肺炎严重程度的预测因子[5],且肺炎严重程度是根据入住普通病房和ICU病房来区分,而本研究根据CURB-65评分来对肺炎是否严重进行分组,其结果显示NLR能区分低危肺炎和中高危肺炎,从而说明NLR能有效评估肺炎严重程度。本研究还发现N在低危肺炎组和正常对照组之间差异无统计学意义,与N相比NLR可预测低危肺炎,因此NLR更为敏感。CRP是炎症和急性期反应的标志物,在肺炎病人中,入院CRP对社区获得性肺炎有重要的预后价值[19],血清CRP可能是一种有用的肺炎辅助检测,也是肺炎病人疗效评估的重要标志物[20]。我们还发现在低危和中高危肺炎病人的血液中hs-CRP水平均高于健康受试者,这些结果表明,即使在低危肺炎病人中,炎症也在持续,且hs-CRP能够评估肺炎严重程度,与文献[21]报道一致。FIB是急性时相反应蛋白,炎症状态下呈上升趋势[22],XU等[21]的研究未发现FIB与社区获得性肺炎严重指数相关,在本研究中采用CURB-65评分系统对肺炎严重程度进行分组,其结果显示FIB不能区分肺炎严重程度,与文献报道一致,说明CURB-65评分系统与肺炎严重指数评分系统在区分肺炎严重程度方面均可靠。
TSGF在非肿瘤疾病如机械性损伤及淋巴结反应性增生已被研究过,且TSGF升高在机械性损伤及淋巴结反应性增生中被证明与炎症反应水平相关[13-14]。迄今为止,关于TSGF与肺炎严重程度关系的研究未见文献报道。在本研究中,我们发现与健康对照组相比,低危肺炎病人的TSGF显著增加,与低危肺炎病人相比,中高危肺炎病人的TSGF水平又进一步的增加。肺炎病人TSGF水平升高与众多周知的肺炎炎症标志物如NLR、hs-CRP、FIB及CURB-65评分呈正相关,在诊断肺炎的ROC曲线中,TSGF的AUC最大,与NLR、hs-CRP、FIB相比,在诊断肺炎方面TSGF可能会提供更多的诊断信息,提示高TSGF与肺炎严重风险增加显著相关,因此TSGF可能是预测肺炎严重程度的重要标志物。
我们的研究中有几个局限性:第一,本研究是一个有限的回顾性病例对照研究,病人的健康状况没有得到充分评估;第二,我们无法获取完整的肺炎严重程度指数评分系统,无法从不同的评分系统来研究TSGF;第三,其他提示性炎症标志物如降钙素原、白细胞介素未被评估等。因此,组织良好的大规模前瞻性设计研究TSGF的确切作用将是笔者进一步的研究方向。
总之,需要开发新的生物标志物来组合评估肺炎的严重程度将会提供更多的诊断信息。据我们所知,这是第一次临床研究表明肺炎病人的TSGF水平升高。因此,TSGF可能是评估肺炎严重程度的一种新的生物标志物,其快速、廉价、诊断效能高、易于分析检测,值得临床推广应用。
肿瘤特异性生长因子在肺炎严重程度评估中的应用
Application value of the tumor-specific growth factor in evaluating the severity of pneumonia
-
摘要:
目的探讨肿瘤特异性生长因子(TSGF)在肺炎严重程度评估中的应用,并与其他已知标志物中性粒细胞(N)与淋巴细胞(L)比值(NLR)、超敏C反应蛋白(hs-CRP)、纤维蛋白原(FIB)比较。 方法分析79例肺炎病人(肺炎组)及40名健康体检者(正常对照组)的临床资料和实验室指标,根据CURB-65评分系统将79例肺炎又分为低危肺炎组42例(CURB-65评分≤ 1)和中高危肺炎组37例(CURB-65评分≥ 2)。检测血清TSGF、hs-CRP、NLR、FIB,Pearson相关分析TSGF与NLR、hs-CRP、FIB之间的相关性,Spearman相关分析TSGF与CURB-65评分之间的相关性,logistic回归分析TSGF、NLR、hs-CRP、FIB、N、L、年龄、性别与肺炎是否严重的相关性,比较TSGF与NLR、hs-CRP、FIB的曲线下面积(AUC),评估其在肺炎诊断中的预测效能。 结果肺炎病人的TSGF高于正常对照组(P < 0.05);低危肺炎病人的TSGF高于正常对照组(P < 0.05),与低危肺炎病人相比,中高危肺炎病人的TSGF进一步升高(P < 0.05);TSGF与hs-CRP、FIB、NLR及CURB-65评分呈正相关(P < 0.05);诊断肺炎的ROC曲线中,TSGF的AUC大于NLR、hs-CRP、FIB(P < 0.05);TSGF与肺炎严重风险提高相关(P < 0.01)。 结论TSGF可能是评估肺炎严重程度的一种新的生物标志物,其快速、诊断效能高、易于分析检测,值得临床推广应用。 -
关键词:
- 肺炎 /
- 肿瘤特异性生长因子 /
- 纤维蛋白原 /
- 超敏C反应蛋白 /
- 中性粒细胞与淋巴细胞比值
Abstract:ObjectiveTo investigate the application value of tumor specific growth factor (TSGF) in evaluating the severity of pneumonia, and compare it with the neutrophil (N) -lymphocyte (L) ratio (NLR), hypersensitive C-reactive protein (hs-CRP) and fibrinogen (FIB). MethodsThe clinical data and laboratory index of 79 pneumonia patients from department of respiratory medicine (pneumonia group) and 40 physical examination people from the physical examination center (control group).According to the scoring system of CURB-65, 79 patients with pneumonia were subdivided into the low-risk pneumonia group (42 cases, CRUB-65 score ≤ 1) and medium-high risk pneumonia group (37 cases, CRUB-65 score ≥ 2).The serum levels of TSGF, hs-CRP, NLR and FIB were detected.The Pearson correlation analysis was used to analyze the correlations between TSGF, and NLR, hs-CRP and FIB, the Spearman correlation analysis was used to analyze the correlation between TSGF and CURB-65 score, and the logistic regression analysis was used to analyze the correlations between TSGF, NLR, hs-CRP, FIB, N, L, age and sex, and severity of pneumonia.The predictive efficacy of the comparison the area under the curve (AUC) of TSGF with NLR, hs-CRP and FIB in the diagnosis of pneumonia was evaluated. ResultsThe TSGF level in pneumonia patients was significantly higher than that in control group (P < 0.05), the TSGF in low-risk pneumonia patients was significantly higher than that in control group (P < 0.05), and the TSGF level in medium-high risk pneumonia group further increased compared with the low-risk pneumonia group (P < 0.05).The TSGF was positively correlated with the scores of hs-CRP, FIB, NLR and CRUB-65 score (P < 0.05).In the ROC curve for predict pneumonia, the AUC of TSGF was significantly greater than that of NLR, hs-CRP and FIB (P < 0.05).TSGF was significantly correlated with the risk of pneumonia severity increasing (P < 0.01). ConclusionsTSGF may be a new biomarker for evaluating the severity of pneumonia, which is rapid, with high diagnostic efficiency, easy to analyze, and worthy of clinical application. -
表 1 肺炎组病人与正常对照组特征及实验室指标结果比较(x±s)
分组 n 男 年龄/岁 TSGF/(U/mL) FIB/(g/L) hs-CRP/(mg/L) N/(109/L) L/(109/L) NLR 正常对照组 40 25 75.9±8.7 29.6±7.7 2.9±0.9 1.8±3.9 3.7±1.3 2.2±0.7 1.8±0.7 肺炎组 79 45 76.8±8.6 64.9±10.5 4.2±1.6 34.4±21.6 6.9±4.7 1.2±0.7 8.4±8.3 t — 0.34# 0.54 18.84 4.76 9.45 4.22 7.36 5.01 P — >0.05 >0.05 < 0.01 < 0.01 < 0.01 < 0.01 < 0.01 < 0.01 #示χ2值  下载: 导出CSV
表 2 低危肺炎组和中高危肺炎组病人及正常对照组临床资料及实验室指标结果比较(x±s)
分组 n 男 年龄/岁 TSGF/(U/mL) FIB/(g/L) hs-CRP/(mg/L) N/(109/L) L/(109/L) NLR 正常对照组 40 25 75.9±8.7 29.6±7.7 2.9±0.9 1.8±3.9 3.7±1.3 2.2±0.7 1.8±0.7 低危肺炎组 42 21 76.1±7.7 60.0±9.2* 4.0±1.6* 27.8±21.7* 5.2±3.9 1.4±0.6* 5.1±6.2* 中高危肺炎组 37 24 77.5±9.6 70.5±9.2*# 4.5±1.5* 42.0±19.1*# 8.8±4.9*# 1.0±0.6*# 12.2±8.9*# F — 2.13# 0.39 231.82 13.91 56.67 19.58 36.96 28.14 P — >0.05 >0.05 < 0.01 < 0.01 < 0.01 < 0.01 < 0.01 < 0.01 MS组内 — — 75.005 76.117 1.875 284.766 13.396 0.404 38.333 #示χ2值;两两比较:与正常对照组比较*P < 0.05;与低危肺炎组比较#P < 0.05
下载: 导出CSV
表 3 4项标志物诊断肺炎的ROC的AUC分析结果
炎症标志物 AUC SE P 95%CI hs-CRP 0.924 0.023 < 0.01 0.861~0.965 TSGF 0.995 0.004 < 0.01 0.960~1.000 NLR 0.864 0.032 < 0.01 0.789~0.920 FIB 0.758 0.045 < 0.01 0.671~0.832
下载: 导出CSV
表 4 6项指标与肺炎病人CURB-65评分相关性分析(rs)
指标 FIB TSGF N L NLR hs-CRP rs 0.234 0.543 0.460 -0.371 0.516 0.364 P < 0.05 < 0.01 < 0.01 < 0.01 < 0.01 < 0.01
下载: 导出CSV
表 5 肺炎严重危险因素多因素logistic回归模型分析
指标 B Waldχ2 OR 95%CI P TSGF 0.192 10.393 1.211 1.078~1.361 < 0.01 NLR -0.005 0.004 0.995 0.838~1.181 >0.05 hs-CRP -0.021 0.690 0.979 0.931~1.029 >0.05 FIB 0.073 0.071 1.076 0.629~1.838 >0.05 N 0.260 3.633 1.297 0.993~1.694 >0.05 L -0.894 1.556 0.409 0.100~1.666 >0.05 年龄 -0.692 2.935 0.912 0.820~1.013 >0.05 性别 -0.081 0.014 0.922 0.243~3.503 >0.05
下载: 导出CSV
-
[1] SUN XY, HE B, SHEN N, et al.Severe Pneumonia and Septic Shock[J].Chest, 2016, 149(4):119A. [2] FUKUYAMA H, ISHIDA T, TACHIBANA H, et al.Validation of scoring systems for predicting severe community-acquired pneumonia[J].Intern Med, 2011, 50(18):1917. [3] SHIMOYAMA Y, UMEGAKI O, INOUE S, et al.The neutrophil to lymphocyte ratio is superior to other inflammation-based prognostic scores in predicting the mortality of patients with pneumonia[J].Acta Med Okayama, 2018, 72(6):591. [4] KARAKONSTANTIS S, KALEMAKI D.Neutrophil to lymphocyte ratio as a risk sratification tool for older adults with pneumonia[J].J Am Geriatr Soc, 2018, 66(2):417. [5] LEE JH, SONG S, YOON SY, et al.Neutrophil to lymphocyte ratio and platelet to lymphocyte ratio as diagnostic markers for pneumonia severity[J].Br J Biomed Sci, 2016, 73(3):140. [6] SHAO TR, HUANG JX, ZHENG ZA, et al.SCCA, TSGF, and the long non-coding RNA AC007271.3 are effective biomarkers for diagnosing oral squamous cell carcinoma[J].Cell Physoil Biochem, 2018, 47(1):26. [7] JI WB, CHEN J, MI YC, et al.CEA, CA125, CA153 and TSGF act as diagnostic tumor biomarkers for patients with rectal carcinoma[J].Int J Clin Exper Med, 2016, 9(10):20109. [8] YIN LK, SUN XQ, MOU DZ.Value of combined detection of serum CEA, CA72-4, CA19-9 and TSGF in the diagnosis of gastric cancer[J].Asian Pac J Cancer Prev, 2015, 16(9):3867. [9] WANG GP, QIN Y, ZHANG JX, et al.Nipple discharge of CA15-3, CA125, CEA and TSGF as a new biomarker panel for breast cancer[J].Int J Mol Sci, 2014, 15(6):9546. [10] LIANG YR, WAN DS, CHEN G, et al.Detection of serum tumor supplied group of factors and its clinical significance[J].Ai Zheng, 2002, 21(11):1251. [11] BARTLETT CS, JEANSSON M, QUAGGIN SE.Vascular Growth Factors and Glomerular Disease[J].Annu Rev Physiol, 2016, 78:437. [12] 张英波.肿瘤特异性生长因子研究进展[J].实用医技杂志, 2012, 19(11):1168. [13] 张喜平, 李昱, 吴斗, 等.机械性创伤患者血清肿瘤特异性生长因子的变化及其临床意义[J].华西医科大学学报, 2001, 32(4):569. [14] 马超, 杨晓春, 闫威, 等.TNF-α及TSGF在淋巴结反应性增生疾病中的表达及意义[J].临床与实验病理学杂志, 2013, 29(2):134. [15] 孔庆华, 白久武, 王晓如.三种评分系统在老年社区获得性肺炎危险度分层及病情评估中的应用[J].中国呼吸与危重监护杂志, 2018, 17(2):138. [16] IMTIAZ F, SHAFIQUE K, MIRZA SS, et al.Neutrophil lymphocyte ratio as a measure of systemic inflammation in prevalent chronic diseases in Asian population.[J].Int Arch Med, 2012, 5(1):2. [17] PANTZARIS ND, PLATANAKI C, PIERRAKO C, et al.Neutrophil-to-lymphocyte ratio relation to sepsis severity scores and inflammatory biomarkers in patients with community-acquired pneumonia:a case series[J].J Transl Int Med, 2018, 6(1):43. [18] LEE JH, YOON SY, KIM HS, et al.Characteristics of the mean platelet volume, neutrophil to lymphocyte ratio, and C-reactive protein compared to the procalcitonin level in pneumonia patients[J].Platelets, 2015, 26(3):278. [19] WANG Y, ZHANG S, LI L, et al.The usefulness of serum procalcitonin, C-reactive protein, soluble triggering receptor expressed on myeloid cells 1 and Clinical Pulmonary Infection Score for evaluation of severity and prognosis of community-acquired pneumonia in elderly patients[J].Arch Gerontol Geriatr, 2019, 80:53. [20] GERVINO G, MANA G, PALMISANO C.C-reactive protein in simple community acquired pneumonia[J].Chest, 2016:99. doi: 10.1378/chest.107.4.1028 [21] 徐悦利, 张阳, 姜峰, 等.不同严重程度社区获得性肺炎患者凝血及纤溶相关指标的比较[J].中华医学杂志, 2015, 95(24):1925. [22] BEAMER N, Coull BM, Sexton G, et al.Fibrinogen and the albumin-globulin ratio in recurrent stroke[J].Stroke, 1993, 24(8):1133. -

 点击查看大图

图(2)表(5)
计量
- 文章访问数: 4169
- HTML全文浏览量: 1944
- PDF下载量: 6
- 被引次数: 0
