

-
颅内动脉瘤(IA)是临床常见的脑血管疾病,因脑动脉内腔局限性非正常扩张致动脉壁瘤状突出。该病是导致蛛网膜下腔出血重要原因,具有较高致残率和死亡率。因IA发生位置较特殊,病情重,使得诊断难度增大,影响到早期治疗。瘤体血流动力学变化在IA发生发展、破裂中有着重要作用,会引起瘤体和载瘤动脉形态学发生改变[1]。所以,IA形态学改变能够反映出瘤体的状态变化,但对于是否具有预测价值临床尚无统一看法,因而需更深入研究。现阶段,数字减影血管造影(DSA)是临床诊断IA的金标准,但费用较昂贵,且有一定创伤性,操作较为复杂。近年来,随着影像学技术创新发展,CTA作为新型诊断技术,有着更高分辨率,且操作便捷、无创,在临床上逐步应用开来。本文主要对我院诊治的103例IA病人的CTA诊断资料进行回顾性研究,分析破裂和未破裂动脉瘤瘤体的形态学特征表现,明确风险因素。现作报道。
-
选择我院2017年1月至2019年5月诊治的103例IA病人临床资料,开展回顾性研究。本组病人均经CTA检查和DSA或手术确诊,术前接受影像学检查。动脉瘤破裂组纳入标准:(1)自发性蛛网膜下腔出血,满足并接受CT血管造影检查,经DSA或手术确诊;(2)既往无自发性蛛网膜下腔出血病史;(3)临床资料完整,具有典型蛛网膜下腔出血的临床表现。未破裂组纳入标准:经CTA、DSA或手术确诊为未破裂动脉瘤,且无典型蛛网膜下腔出血临床表现。2组排除标准:(1)外伤性动脉瘤;(2) CTA成像质量不佳无法评价形态学特征;(3)难于显示瘤颈及与载瘤动脉解剖关系;(4)伴血管畸形。本研究得到医院伦理委员会批准。103例中,男49例,女44例;年龄37~79岁;单发动脉瘤94例,多发动脉瘤9例;破裂组动脉瘤78例(84个瘤体),未破裂组动脉瘤25例(28个瘤体)。
-
应用飞利浦公司生产的AlluraXper FD20型DSA机进行检查,并备好高压注射机,采用改良式Seldinger技术经股动脉完成穿刺,选择性穿刺超选到双侧颈内动脉、前交通动脉、双侧椎动脉。在进行造影时,X线C臂需旋转240°/4.1 s,并准确采集每秒30帧图像,矩阵为1024×1024。
-
应用荷兰Philips公司提供的Brilliance 64排128层螺旋CT,扫描方式为螺旋扫描,扫描方案为病人仰卧位,扫描范围自主动脉弓至颅顶。头颈部CTA扫重建矩阵512,准直器64×0.625,螺距0.923。应用高压注射器经肘静脉注入对比剂碘普罗胺(370)60~80 mL,注射流率为4.0~4.5 mL/s,扫描条件为管电压120 kV,管电流250 mAs/Slice,层厚0.9 mm,间隔0.45 mm,使用对比剂团注示踪技术扫描。
-
扫描获取的容积数据传输至Philips公司提供的Extended Brilliance Workspace 4.5工作站对所得图像进行后处理,应用多平面重建(MPR)、最大密度投影(MIP)及容积再现技术(VR)等行三维重建。为保证动脉瘤有关指标测量的准确性和一致性,由2名高年资神经放射医生分别独立测定动脉瘤病人参数,将平均值应用到后续分析中。
-
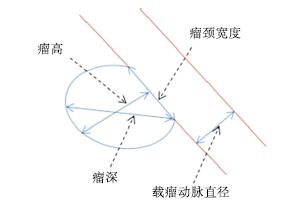
观察并记录本组病人破裂与未破裂数量,掌握单发病例和多发病例的破裂发生数量;同时要掌握本组病人的动脉瘤分布部位,主要是后交通动脉、前交通动脉、大脑中动脉、大脑前动脉等,同时掌握动脉瘤数量、测定瘤体长度(即瘤体深度)、瘤颈宽度,同时计算出瘤体高度和瘤颈宽度比(AR)、瘤体深度和载瘤动脉直径比(SR)、动脉瘤面积与瘤颈处载瘤动脉面积比值(面积比)的数值(见图 1);同时观察和统计本组病人的子囊数量。
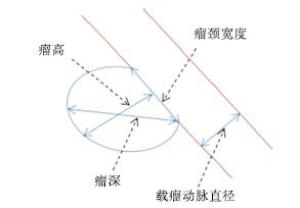
图 1 颅内动脉瘤CTA相关参数测量方法
-
采用t检验、χ2检验以及logistic回归分析。
-
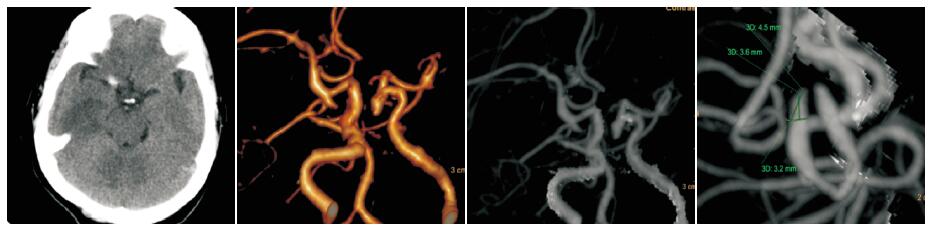
本组103例病人经CTA检查和DSA术中确诊,瘤体破裂78例,占比75.73%,未破裂瘤体25例,占比24.27%。典型病例见图 2~3。
图 2 IA未破裂, 女,48岁, 两侧后交通动脉瘤, 右侧测量:瘤高3.6 mm, 瘤颈3.2 mm, 瘤深4.5 mm, AR=1.13
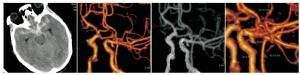
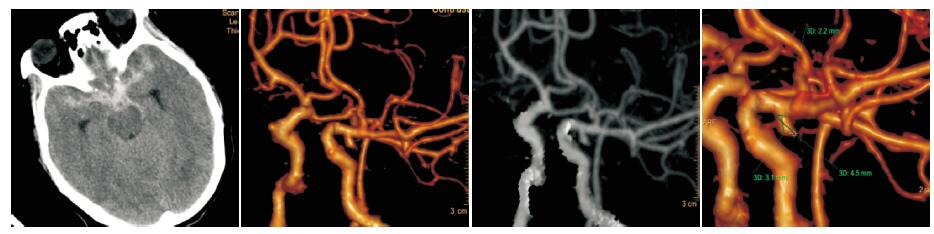
图 3 IA破裂, 女, 51岁, 左侧后交通动脉瘤, 测量:瘤高3.1 mm, 瘤颈2.2 mm, 瘤深4.5 mm, AR=1.41
-
通过对破裂组和未破裂组病人CTA分析,瘤体大小、瘤体位置、AR、SR、面积比及子囊数差异有统计学意义(P<0.05);IA破裂率以后交通动脉为主,其次是前交通动脉、大脑中动脉、大脑前动脉,最后是后循环,差异有统计学意义(P<0.05~P<0.01)(见表 1)。
分组 n 瘤体大小/mm 瘤颈/mm AR SR 面积比 单发 子囊数
[n; (百分率)%]病灶位置[n; (百分率)%] 后交通动脉 前交通动脉 大脑中动脉 大脑前动脉 后循环 破裂组 78 6.05±2.89 3.18±1.57 1.69±0.83 2.25±0.82 3.03±0.95 72 47(60.26) 26(33.33) 19(24.36) 18(20.08) 9(11.54) 6(7.69) 未破裂组 25 4.53±1.75 2.91±0.97 1.25±0.68 1.60±0.85 1.95±0.60 24 6(24.00) 3(12.00) 4(16.00) 5(20.00) 6(24.00) 7(28.00) t — 2.48 0.81 2.40 3.42 5.34 0.41* 9.96* 11.94* P — < 0.05 > 0.05 < 0.05 < 0.01 < 0.01 > 0.05 < 0.01 <0.05 *示χ2值 表 1 IA破裂组和未破裂组形态学表现比较(x±s)
-
以IA破裂为自变量,以表 1存在统计学差异指标作为变量,进行logistic回归分析,结果表明瘤体大小、AR、SR、面积比是IA瘤体破裂的独立风险因素(见表 2)。
变量 β SE Wald P OR 95%CI 瘤体大小 1.16 0.48 5.84 <0.05 3.19 1.25~8.17 AR 0.48 0.22 4.76 <0.05 1.62 1.05~2.49 SR 0.38 0.18 4.46 <0.05 1.46 1.03~2.08 面积比 1.08 0.45 5.76 <0.05 2.94 1.22~7.11 表 2 IA病人的形态学特征指标logistic回归分析结果
-
IA破裂引起的蛛网膜下腔出血是致死致残率较高的脑血管病,临床发病原因主要是脑血管先天缺陷、动脉粥样硬化等。以单发为主,多发相对较少。该病具有较高的死亡率,且在出血性脑血管病变中的死亡率更高,所以必须尽早诊治,更好地改善预后[2]。
CTA是一种新型无创性诊断技术,临床应用日益广泛,能够较准确地显示IA的病变表现,且能更全面、准确地预测病情发展情况,为临床治疗给予提供针对性的指导,而影响到预后,提升病人生存生活质量[3]。CTA成像原理就是经静脉注射对比剂后,在靶血管内及循环血中的浓度达到峰值,再通过CT扫描,将得到影像数据通过专业计算机软件进行处理建立三维图像,能够更清晰地显示颅内动脉主干血管壁及周围微动脉分支。在检查中,要控制好对比剂流速,确保靶血管内对比剂浓度较高,以提升扫描效果。但要注意的是,空间分辨力和对比剂注射流速直接关系到结果准确性[4]。
临床学者[5]对未破裂IA病人进行5年以上随访发现,多发IA的破裂发生率是6.8%,单发IA为1.9%,差异有统计学意义;多发IA破裂风险是单发IA的近2倍[6]。本研究中,单发IA破裂72例,多发IA破裂6例,发生率无明显差异,这与有关研究报道的结果有所不同,原因可能是因为本研究资料的破裂病例和多发IA的样本较少。另外,多发IA破裂出血临床预后相比单发要差,因而早期处理责任瘤体是治疗关键,但是对于非责任瘤体的处理当前临床尚无统一标准。所以,在多发IA处理时,关键是要准确判断责任瘤体,特别是在病人无法一次性完成处理时。可通过以下几点来判断多发IA中的责任动脉瘤:(1)CTA图像中显示出血量集中位置,尤其是局部血肿部位;(2)病人存在明确的定位体征,如动眼神经麻痹;(3)瘤体形态不规则或者体积偏大;(4)表现出多分叶形状、凸起。
IA破裂是引起自发性蛛网膜下腔出血主要原因,有着很高死亡率和致残率。从临床实际情况看,大部分病例是因出现蛛网膜下隙出血行CTA检查检出动脉瘤,在瘤体发生破裂后会造成严重后果,但并不是所有未破裂瘤体都会破裂,同时加上各种预防性干预医疗风险和IA自然破裂率相近,所以未破裂IA治疗策略是神经外科一个争议所在。现阶段,尚无简单、便捷、准确、易行的未破裂IA破裂风险预测指标。预测IA破裂风险的指标主要是通过IA瘤体的位置、瘤壁形态,IA位于后交通动脉和不规则瘤壁的破裂风险明显增加;但破裂动脉瘤中有很大一部分并非发生于后交通动脉与不规则瘤壁。本研究中,IA破裂率以后交通动脉最高,占到33.33%,其次是前交通动脉、大脑中动脉、大脑前动脉及后循环,分别为24.36%、20.08%、11.54%、7.69%。IA位于后交通动脉时的破裂风险增加,但是IA位于后交通动脉与不规则瘤壁并非一定会破裂[6-7]。
虽然诸多研究发现IA破裂病人和未破裂病人间瘤体大小、AR、SR能有效预测IA破裂的风险,但这类研究结果仍未达成共识,存在很大的争议。此种不一的研究结果可能是因为这几方面导致的:(1)预测IA发生破裂时,未调节病人的个体性影响因素;(2)临床学者应用现代多种影像技术(CTA、MRA、DSA)以及相应的图像测量和后处理方法[8-9]。本研究中,以瘤体形态学指标和病人临床情况作为调节变量,通过多因素logistic回归分析计算, 结果显示,瘤体大小、AR和SR均为动脉瘤破裂的独立风险因素(P<0.05)。对于面积比值不但考虑动脉瘤自身因素(瘤体的高度与宽度),且还需考虑载瘤动脉直径以及瘤颈。对相关变量进行多因素logistic回归分析,结果表明面积比和IA破裂具有相关性。另外,破裂组病例的动脉瘤面积比大于未破裂病例。伴随动脉瘤瘤体的进展增大,瘤内的血流变缓,瘤壁的剪切力也会减小,而动脉瘤更易破裂[10]。基于这些研究结果,本研究从血流动力学角度对面积比进行系统论述。本研究将动脉瘤面积(A1)表示在单位时间内动脉瘤可以容纳血容量,对于瘤颈处载瘤动脉面积(A2)意味着载瘤动脉在单位时间内可通过瘤颈供给动脉瘤血容量。如在A1相同的条件下,A2越小表示载瘤动脉单位时间内可通过的瘤颈供给动脉瘤血量越少,其瘤内血流速度会逐步变缓,瘤体内壁面切应力整体会变低,IA越易出现破裂[11]。在A2相同条件下,A1越大表示单位时间内动脉瘤能容纳血容量就会越大,IA瘤内血流速度会随着变,瘤内平均壁面切应力就会越低,动脉瘤更易发生破裂[12]。
近年来,子囊逐步成为破裂动脉瘤一个判断的重要根据,同时可及时传递出破裂的危险信号。国外研究学者指出子囊形成对于动脉瘤的破裂存在影响[13]。本研究结果显示,破裂组病人的子囊存在率为60.26%,高于未破裂组的24.00%(P<0.01)。所以,子囊形成是动脉瘤破裂一个危险因素,据统计,存在子囊的IA破裂风险是无子囊形成的5.6倍,但是子囊存在数和分布与IA破裂不具相关性[14]。
综上所述,CTA能够准确、清晰地显示出IA的形态学特征,其中瘤体大小、AR、SR及面积比等形态学表现是IA破裂风险的独立评估指标。但因样本数量影响,本研究结论存在一定不足,未来需开展大样本的课题研究,以保证结果的准确性。
颅内动脉瘤破裂风险评估中CTA的有效性及形态学特征分析
Analysis of the CTA effectiveness in the assessment of the rupture risk of intracranial aneurysm, and its morphological characteristics
-
摘要:
目的探讨颅内动脉瘤(intracranial aneurysm,IA)风险评估中CT血管造影成像(CTA)应用有效性,并对其形态学特征进行系统分析。 方法回顾性研究2017年1月至2019年5月103例IA病人临床资料,对比破裂和未破裂者CTA影像形态学表现,并分析与瘤体破裂的相关性。 结果103例病人中,瘤体破裂78例(84个瘤体),未破裂瘤体25例(28个瘤体);IA破裂以后交通动脉为主,其次是前交通动脉、大脑中动脉、大脑前动脉、后循环,差异有统计学意义(P < 0.05);破裂组和未破裂组病人的瘤体大小、瘤体位置、瘤体高度和瘤颈宽度比(AR)、瘤体深度和载瘤动脉直径比(SR)、动脉瘤面积与瘤颈处载瘤动脉面积比值(面积比)及子囊数差异均有统计学意义(P < 0.05~P < 0.01);logistic回归分析表明,瘤体大小、AR、SR、面积比是动脉瘤瘤体破裂独立危险因素(P < 0.05)。 结论CTA可清晰、准确显示颅内动脉瘤形态学特征,瘤体大小、AR、SR及面积比等形态学表现可作为IA破裂风险的独立评估指标。 Abstract:ObjectiveTo explore the effectiveness of CT angiography(CTA) in the risk assessment of intracranial aneurysm(IA), and systematically analyze its morphological features. MethodsThe clinical data of 103 patients with IA from January 2017 to may 2019 were retrospectively analyzed.The CTA image morphology between ruptured and unruptured patients was compared, and its correlation with tumor rupture was analyzed. ResultsAmong 103 patients, 78 cases(84 tumors) ruptured, and 25 cases(28 tumors) did not rupture.The rupture of traffic artery was mainly after IA, followed by anterior communicating artery, middle cerebral artery, anterior cerebral artery and posterior circulation, and the difference between the anterior and posterior cerebral arteries was statistically significant(P < 0.05).The differences of the tumor size, tumor location, tumor height, tumor neck width ratio(AR), tumor depth to tumor carrier artery diameter ratio(SR), area ratio(ratio of aneurysm area to tumor neck carrier artery area ratio) and number of sac between the ruptured group and non ruptured group were statistically significant(P < 0.05 to P < 01).The results of logistic regression analysis showed that the tumor size, AR, SR and area ratio were the independent risk factors of aneurysm rupture(P < 0.05). ConclusionsCTA can clearly and accurately reflect the morphological features of intracranial aneurysms.The morphological findings such as tumor size, AR, SR and area ratio can be used as the independent evaluation indicators of IA rupture risk. -
Key words:
- intracranial aneurysm /
- risk of rupture /
- CT angiography /
- morphological feature
-
表 1 IA破裂组和未破裂组形态学表现比较(x±s)
分组 n 瘤体大小/mm 瘤颈/mm AR SR 面积比 单发 子囊数
[n; (百分率)%]病灶位置[n; (百分率)%] 后交通动脉 前交通动脉 大脑中动脉 大脑前动脉 后循环 破裂组 78 6.05±2.89 3.18±1.57 1.69±0.83 2.25±0.82 3.03±0.95 72 47(60.26) 26(33.33) 19(24.36) 18(20.08) 9(11.54) 6(7.69) 未破裂组 25 4.53±1.75 2.91±0.97 1.25±0.68 1.60±0.85 1.95±0.60 24 6(24.00) 3(12.00) 4(16.00) 5(20.00) 6(24.00) 7(28.00) t — 2.48 0.81 2.40 3.42 5.34 0.41* 9.96* 11.94* P — < 0.05 > 0.05 < 0.05 < 0.01 < 0.01 > 0.05 < 0.01 <0.05 *示χ2值  下载: 导出CSV
表 2 IA病人的形态学特征指标logistic回归分析结果
变量 β SE Wald P OR 95%CI 瘤体大小 1.16 0.48 5.84 <0.05 3.19 1.25~8.17 AR 0.48 0.22 4.76 <0.05 1.62 1.05~2.49 SR 0.38 0.18 4.46 <0.05 1.46 1.03~2.08 面积比 1.08 0.45 5.76 <0.05 2.94 1.22~7.11
下载: 导出CSV
-
[1] 黄钦江, 孙晓川.CTA在颅内动脉瘤临床应用中的进展[J].中国神经精神疾病杂志, 2015, 41(10):638. [2] 张丹, 李彩英, 高不郎, 等.颅内动脉瘤血流动力学发病机制研究进展[J].介入放射学杂志, 2017, 26(4):378. [3] 刘鸣.神经内科学[M].北京:人民卫生出版社, 2010:344. [4] 吴桐, 王凯, 艾林, 等.CT血管造影与MR血管造影对颅内动脉瘤诊断价值的对比研究[J].磁共振成像, 2015, 6(5):339. [5] 李立, 钱伟军, 王亚军, 等.基于64排CTA技术的颅内单发囊性动脉瘤破裂风险研究[J].中国实用神经疾病杂志, 2017, 20(7):38. [6] ELLAMUSHI HE, GRIEVE JP, JAGER HR, et al.Risk factors for the formation ofmultiple intracranial aneurysms[J].JNeurosurg, 2001, 94(5):728. [7] 陶元丰, 杨兰.手术治疗颅内动脉瘤破裂的疗效观察[J].新疆医学, 2018, 48(1):80. [8] 陈解南, 黄钟情, 孟志华.运用CTA分析镜像后交通动脉瘤破裂的危险因素[J].山西医科大学学报, 2016, 47(5):463. [9] 李不言, 袁盾, 姜维喜, 等.颅内动脉瘤破裂的影响因素分析[J].国际神经病学神经外科学杂志, 2019, 46(3):246. [10] 袁金龙, 方兴根, 李真保, 等.子囊型后交通动脉动脉瘤血流动力学和形态学的计算机数值模拟分析[J].中国脑血管病杂志, 2016, 13(6):313. [11] GEORG B, MALTE NB, JOHANN MH, et al.Follow-up CT and CT angiography after intracranial aneurysm clipping and coiling-improved image quality by iterative metal artifact reduction[J].Neuroradiology, 2017, 59(7):409. [12] 卢绍路, 谢艺才.三维体积扫描飞跃法磁共振血管成像在脑血管疾病诊断中的应用价值[J].实用医学影像杂志, 2016, 17(3):257. [13] VINCENT D, MARTINE B, STEVEN DH, et al.Impact of metal artifact reduction software on image quality of gemstone spectral imaging dual-energy cerebral CT angiography after intracranial aneurysm clipping[J].Neuroradiology, 2017, 59(9):344. [14] 金梅, 刘力, 李鑫, 等.双源CT四维动态螺旋扫描对颅内动脉瘤破裂风险的评估价值[J].影像研究与医学应用, 2019, 3(16):23. -

 点击查看大图
图(3)表(2)
计量
- 文章访问数: 4536
- HTML全文浏览量: 2133
- PDF下载量: 16
- 被引次数: 0
