


-
准确的术前评估是麻醉医师和手术医师为手术病人制定合理的围手术期管理策略的必要前提。充分、精准的术前评估能够为病人术后可能出现的并发症和不良事件提前做好预案,从而减少术后并发症,降低病人术后死亡率[1-3]。术前访视是术前评估的重要环节,然而术前访视主要依赖于麻醉医师的个人经验和判断,主观性较强。因此,一系列评分或分级系统被开发并用于术前评估,如美国麻醉师协会(ASA)分级系统[4]、序贯器官衰竭评分(SOFA)系统[5]、急性生理与慢性健康评分(APACHE Ⅱ)系统[6]等。但这些系统在开发时并未考虑不同手术部位对术后并发症及死亡风险的影响,因此缺乏特异性。随着我国医疗水平的提高,各大三级医院每年手术量呈上升趋势。然而,目前对于普外科最常见的腹部手术仍缺乏客观、准确、特异性强的术前评估系统[7]。近年来,随着人工智能科技和机器学习技术的在医学领域的发展,利用人工智能技术对既往数据进行挖掘、学习,并形成预测模型进行预警评估的策略成为可能[8-10]。本研究拟通过机器学习分类算法的佼佼者支持向量机模型,预测腹部手术病人术后28 d的死亡风险,为腹部手术病人术前风险评估提供新的方法。
-
纳入标准:2015年7月至2017年6月期间收治于宝山区中西医结合医院并行腹部手术的病人。排除标准:产科手术;年龄 < 6岁的儿科手术;合并其他部位手术(如胸腹联合手术等);建模指标或预后结局缺失者。
-
经过专家查阅文献和专家讨论,最终确定了三个模块共29变量进行建模,(1)病人的一般情况:性别、年龄、体质量指数(BMI)、术前合并症等;(2)麻醉术前访视情况:手术类型(择期或急诊)、美国麻醉师协会(ASA)分级、心率(HR)、平均动脉压(MAP);(3)实验室检查:白细胞计数(WBC)、血红蛋白浓度(Hb)、血小板计数(PLT)、丙氨酸氨基转移酶(ALT)、天门冬氨酸氨基转移酶(AST)、胆红素(BIL)、白蛋白(ALB)、尿素氮(BUN)、血肌酐(SCr)、D二聚体(DDimer)、国际标准化比值(INR)、降钙素原(PCT)、C反应蛋白(CRP)。所有临床数据集实验室指标通过访问我院电子病例系统获得,对于住院期间手术次数>1次者,仅纳入第一次手术时的指标。
-
腹部术后病人28 d内出现死亡事件。
-
将所有病人通过随机抽样将所有病人以7∶ 3比例分配训练集和验证集。对于计量资料首先进行正态分布检验,符合正态分布的计量资料以均数(标准差)表示,组间比较使用独立样本t检验;非正态分布的计量资料以中位数(四分位间距)表示,组间比较采用Wilcoxon秩和检验。计数资料使用个数(百分比)表示,组间比较采用χ2检验或Fisher精确概率法。不同模型的受试者工作曲线(ROC)下面积比较采用Delong检验。所有数据分析使用R软件平台(版本3.6.2)完成。
-
基于训练集数据,使用e1071包构建支持向量机模型,使用tune.svm()函数进行交叉验证并调整参数达到最优,核函数kernel设置为线性,最优成本函数cost设置选项为(0.001, 0.01, 0.1, 1, 5, 10)[11-12]。完成最优支持向量机模型构建后,分别在训练集和测试集上进行预测和验证,评价模型的敏感性、特异性、阳性预测值、阴性预测值、准确率等指标,并构建支持向量机模型预测术后死亡事件的ROC曲线,并计算ROC曲线下面积[13-14]。为了进一步评价支持向量机模型的工作性能,我们使用广义线性模型函数glm()构建了多因素logistic回归模型对术后死亡事件进行预测,并在训练集和测试集中比较支持向量机模型和传统logistic回归模型的工作性能[15]。
-
腹部手术病人的基本信息及预后如表 1所示,研究共纳入手术病人1 512例,其中男911例(60.25%),女601例(39.75%),年龄(62.83±12.33)岁。其中115例(7.61%)病人在术后28 d死亡。急诊手术病人209例,占总手术人数的13.82%,按照美国麻醉师协会(ASA)分级,Ⅰ级、Ⅱ级、Ⅲ级、Ⅳ级、Ⅴ级的人数分别占总手术人数的6.55%、69.64%、16.53%、6.08%、1.19%。术前发病率最高的前三位合并病分别为高血压(219例,14.48%)、慢性心功能不全(176例,11.64%)、糖尿病(138例,9.13%)。通过随机抽样分配后(7∶ 3),得到训练集病人1 048例,验证集病人464例。所有建模指标中,除性别和免疫抑制情况在训练集和验证集的比例存在差异(P<0.05),余指标在训练集和验证集中均无显著性差异(P>0.05)(见表 1)。
指标 总数(n=1 512) 训练集(n=1 048) 测试集(n=464) t/χ2 P 年龄/岁 62.83±12.33 62.51±12.32 63.56±12.31 1.53* >0.05 性别 男 911(60.25) 611(58.30) 300(64.66) 5.42 < 0.05 女 601(39.75) 437(41.70) 164(35.34) BMI/(kg/m2) 21.96±2.25 21.90±2.25 22.09±2.25 1.56* >0.05 急诊手术 是 209(13.82) 153(14.60) 56(12.07)) 1.73 >0.05 否 1 303(86.18) 895(85.40) 408(87.93) ASA分级 Ⅰ级 99(6.55) 72(6.87) 27(5.82) 5.70 >0.05 Ⅱ级 1 053(69.64) 715(68.23) 338(72.84) Ⅲ级 250(16.53) 180(17.18) 70(15.09) Ⅳ级 92(6.08) 65(6.20) 27(5.82) Ⅴ级 18(1.19) 16(1.53) 2(0.43) 术前合并症 慢性心功能不全 176(11.64) 128(12.21) 48(10.34) 1.09 >0.05 慢性阻塞性肺疾病 110(7.28) 81(7.73) 29(6.25) 1.04 >0.05 慢性肝功能不全 80(5.29) 63(6.01) 17(3.66) 3.54 >0.05 慢性肾功能不全 96(6.35) 75(7.16) 21(4.53) 3.74 >0.05 糖尿病 138(9.13) 100(9.54) 38(8.19) 0.71 >0.05 高血压 219(14.48) 160(15.27) 59(12.72) 1.69 >0.05 脑卒中 133(8.80) 96(9.16) 37(7.97) 0.56 >0.05 恶性肿瘤 126(8.33) 93(8.87) 33(7.11) 1.31 >0.05 免疫抑制 47(3.11) 40(3.82) 7(1.51) 5.69 < 0.05 术后28 d内死亡 是 115(7.61) 70(6.68) 45(9.70 4.17 < 0.05 否 1 397(92.39) 978(93.32) 419(90.30) MAP/mmHg 83.64±20.01 83.75±19.49 83.37±21.16 0.91△ >0.05 HR/(次/分)) 92.22±35.24 91.40±34.86 94.07±36.06 1.24△ >0.05 WBC/(×109/L) 9.11±4.79 8.98±4.78 9.38±4.82 1.29△ >0.05 Hb/(g/L) 127.42±17.63 127.07±17.89 128.19±17.02 0.98△ >0.05 PLT/(×109/L) 202.57±95.23 200.18±94.80 207.97±96.09 1.27△ >0.05 ALT/(U/L) 27.90±19.79 27.54±19.54 28.71±20.35 0.83△ >0.05 AST/(U/L) 34.52±19.74 34.21±19.37 35.21±20.56 0.61△ >0.05 BIL/(μmmol/L) 12.65±10.31 12.49±9.90 13.00±11.18 0.50△ >0.05 ALB/(g/L) 34.04±14.59 33.82±14.72 34.53±14.28 0.87△ >0.05 BUN/(mmol/L) 5.58±2.74 5.62±2.81 5.50±2.58 0.11△ >0.05 SCr/(μmmol/L) 74.63±22.55 74.80±23.02 74.25±21.48 0.37△ >0.05 DDimer/(mg/L) 1.02±1.40 0.97±1.23 1.12±1.71 0.59△ >0.05 INR 1.08±0.32 1.07±0.31 1.09±0.35 0.93△ >0.05 PCT/(ng/mL) 0.58±1.34 0.60±1.33 0.54±1.35 1.78△ >0.05 CRP/(mg/dL) 40.33±29.05 41.43±29.90 37.84±26.88 1.80△ >0.05 *示t值;△示Z值 表 1 腹部手术病人基本信息及预后
-
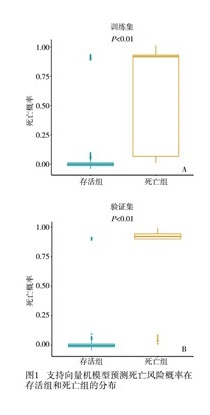
使用支持向量机预测每个腹部术后病人死亡概率在存活组和死亡组间的分布见图 1。训练集中,死亡组的死亡预测概率显著高于存活组的死亡预测概率(P<0.01)(见图 1A)。验证集中死亡组的死亡预测概率显著高于存活组的死亡预测概率(P<0.01)(见图 1B)。

图 1 支持向量机模型预测死亡风险概率在存活组和死亡组的分布
-
在训练集中,支持向量机模型的ROC曲线下面积高于logistic回归模型,但差异无统计学意义(0.97 vs 0.95, P>0.05)。类似的,在验证集中,支持向量机的ROC曲线下面积显著高于logistic回归模型(0.98 vs 0.91, P<0.05)。2种模型的预测准确性均在95%~97%之间,但支持向量机模型的敏感性(训练集68.57% vs 62.86%,验证集79.78% vs 77.78%)和阳性预测值(训练集80.00% vs 65.75%,验证集83.33% vs 77.13%%)优于传统logistic回归模型,提示支持向量机模型能够更准确的识别出死亡高风险人群(见表 2、图 2)。
模型 ROC曲线下面积 敏感性/% 特异性/% 准确率/% 阳性预测值/% 阴性预测值/% 支持向量机模型(训练集) 0.97 68.57 97.44 95.52 80.00 97.74 logistic模型(训练集) 0.95 62.86 98.88 96.47 65.75 97.38 支持向量机模型(验证集) 0.98 79.78 98.33 96.34 83.33 97.63 logistic模型(验证集) 0.91 77.78 99.05 96.98 77.13 99.05 表 2 支持向量机模型与logisitc回归模型的ROC曲线的参数

图 2 logistic回归模型和支持向量机模型预测腹部术后死亡事件的ROC曲线
-
利用人工智能技术和机器学习算法对既往医疗数据进行挖掘、学习,并建立预测模型是近年来智慧医疗领域的研究热点。本研究基于既往腹部手术病人的临床数据,通过机器学习算法中的支持向量机模型,建立了腹部病人术后28 d死亡风险的预测分类器。这一模型无论是在训练集和验证集均取得了良好的工作性能,ROC曲线下面积分别达到0.97和0.98,优于传统logistic模型的预测效果。
支持向量机的雏形是Vapnik和他的ATT Bell实验小组在20世纪90年代中期提出。该算法以得到现有信息下的最优解为目标,采用结构风险最小化准则设计学习机器,并在建模过程中通过调节向量机模型的核函数及误差惩罚参数寻求最优的向量机性能[16]。由于支持向量机可将非线性问题变换转换到高维的特征空间的线性约束条件下的凸二次规划问题,因此理论上可以得到全局最优解,这一特性解决了神经网络方法中的“局部极值问题”,且巧妙的避免了“维数灾难”问题。不仅如此,支持向量机折衷考虑了经验风险和置信范围,具有较强的推广性。
支持向量机模型较好地解决了人工智能算法中的非线性、高维数、局部极小点等问题[17-18]。正因如此,支持向量机越来越多的被运用于医学领域。一项发表于国外的研究[19]显示,基于免疫组织化学的特征的支持向量机模型能够准确预测胃癌术后病人的总生存时间和无病生存时间。不仅如此,另一项基于生信分析的支持向量机模型[20]显示,富集于内质网(如SSR3)、AMPK信号通路(如CREB1)和泛素介导的蛋白质水解(如FBXO2、CUL7和UBE2D3)等信号通路的分子,能够准确地区分转移性和非转移性结直肠癌,并作为转移性大肠癌预后的生物标志物。我们的研究使用腹部术前病人一般情况、术前访视、实验室检查等指标作为建模变量,准确的预测了病人术后28 d死亡风险的预后,拓展了支持向量机的应用领域。机器学习中的支持向量机模型能够准确预测腹部手术病人28 d死亡风险,其工作性能强于传统的logistic回归模型。
本研究有一定的局限性。首先,本研究为单中心研究,研究的结论是否适用于其他中心仍需在其他中心的数据中进行验证。其次,本研究为回顾性研究,部位病人因临床数据缺失未被纳入建模,因此有选择性偏倚的风险。再次,本研究中纳入的建模变量是查阅文献和专家讨论后确定,但仍有可能存在对死亡时间有预测作用,却没有参与建模的临床变量存在。因此,模型的预测准确性可能因一些测量变量未被纳入而降低。
支持向量机算法预测腹部术后病人死亡风险模型的建立及验证
Development and validation of the support vector machine model for predicting the risk of death in patients after abdominal surgery
-
摘要:
目的 通过支持向量机算法,建立预测腹部手术病人术后28 d的死亡风险模型。 方法收集2015年7月至2017年6月期间行腹部手术的病人的术前一般情况、术前访视情况、实验室检查等指标,基于支持向量机算法建立并验证预测腹部术后的死亡风险模型,并与传统logistic回归模型比较,评价支持向量机模型的工作性能。 结果共纳入手术病人1 512例,其中男911例(60.25%%),女601例(39.75%)。训练集和测试集中,死亡组的死亡预测概率高于存活组(P < 0.01)。训练集中,支持向量机模型的ROC曲线下面积高于logistic回归模型,但差异无统计学意义(0.97 vs 0.95, P>0.05)。验证集中,支持向量机的ROC曲线下面积高于logistic回归模型(0.98 vs 0.91, P < 0.05)。支持向量机模型的敏感性(训练集68.57% vs 62.86%,验证集79.78% vs 77.78%)和阳性预测值(训练集80.00% vs 65.75%,验证集83.33% vs 77.13%)优于传统logistic回归模型。 结论支持向量机模型能够准确预测腹部手术病人28 d死亡风险,其工作性能强于传统的logistic回归模型。 -
关键词:
- 腹部手术 /
- 支持向量机模型 /
- 受试者工作曲线 /
- 死亡风险 /
- logistic回归模型
Abstract:ObjectiveTo develop a model for predicting the 28-day death risk in patients with abdominal surgery using support vector machine algorithm. MethodsThe preoperative general conditions, preoperative visits, laboratory tests and other indicators of patients treated with abdominal surgery from July 2015 to June 2017 were collected.The logistic regression model was compared to evaluate the performance of support vector machine model. ResultsA total of 1 512 surgical patients were included, including 911 males(60.25%) and 601 females(39.75%).In both of the training set and validation set, the predicted probability of death in death group was significantly higher than that in survival group(P < 0.01).In the training set, the area under ROC curve of support vector machine model was larger compared with the logistic regression model, but the difference of which was not statistically significant(0.97 vs 0.95, P>0.05).In the validation set, the area under the ROC curve of support vector machine was significantly higher than that of logistic regression model(0.98 vs 0.91, P < 0.05).The sensitivity(training set 68.57% vs 62.86%, validation set 79.78% vs 77.78%) and positive predictive value(training set 80.00% vs 65.75%, validation set 83.33% vs 77.13%) of support vector machine model were better than those of traditional logistic regression model. ConclusionsThe support vector machine model can accurately predict the risk of 28-day death in patients with abdominal surgery, and its performance is better than that of traditional logistic regression model. -
表 1 腹部手术病人基本信息及预后
指标 总数(n=1 512) 训练集(n=1 048) 测试集(n=464) t/χ2 P 年龄/岁 62.83±12.33 62.51±12.32 63.56±12.31 1.53* >0.05 性别 男 911(60.25) 611(58.30) 300(64.66) 5.42 < 0.05 女 601(39.75) 437(41.70) 164(35.34) BMI/(kg/m2) 21.96±2.25 21.90±2.25 22.09±2.25 1.56* >0.05 急诊手术 是 209(13.82) 153(14.60) 56(12.07)) 1.73 >0.05 否 1 303(86.18) 895(85.40) 408(87.93) ASA分级 Ⅰ级 99(6.55) 72(6.87) 27(5.82) 5.70 >0.05 Ⅱ级 1 053(69.64) 715(68.23) 338(72.84) Ⅲ级 250(16.53) 180(17.18) 70(15.09) Ⅳ级 92(6.08) 65(6.20) 27(5.82) Ⅴ级 18(1.19) 16(1.53) 2(0.43) 术前合并症 慢性心功能不全 176(11.64) 128(12.21) 48(10.34) 1.09 >0.05 慢性阻塞性肺疾病 110(7.28) 81(7.73) 29(6.25) 1.04 >0.05 慢性肝功能不全 80(5.29) 63(6.01) 17(3.66) 3.54 >0.05 慢性肾功能不全 96(6.35) 75(7.16) 21(4.53) 3.74 >0.05 糖尿病 138(9.13) 100(9.54) 38(8.19) 0.71 >0.05 高血压 219(14.48) 160(15.27) 59(12.72) 1.69 >0.05 脑卒中 133(8.80) 96(9.16) 37(7.97) 0.56 >0.05 恶性肿瘤 126(8.33) 93(8.87) 33(7.11) 1.31 >0.05 免疫抑制 47(3.11) 40(3.82) 7(1.51) 5.69 < 0.05 术后28 d内死亡 是 115(7.61) 70(6.68) 45(9.70 4.17 < 0.05 否 1 397(92.39) 978(93.32) 419(90.30) MAP/mmHg 83.64±20.01 83.75±19.49 83.37±21.16 0.91△ >0.05 HR/(次/分)) 92.22±35.24 91.40±34.86 94.07±36.06 1.24△ >0.05 WBC/(×109/L) 9.11±4.79 8.98±4.78 9.38±4.82 1.29△ >0.05 Hb/(g/L) 127.42±17.63 127.07±17.89 128.19±17.02 0.98△ >0.05 PLT/(×109/L) 202.57±95.23 200.18±94.80 207.97±96.09 1.27△ >0.05 ALT/(U/L) 27.90±19.79 27.54±19.54 28.71±20.35 0.83△ >0.05 AST/(U/L) 34.52±19.74 34.21±19.37 35.21±20.56 0.61△ >0.05 BIL/(μmmol/L) 12.65±10.31 12.49±9.90 13.00±11.18 0.50△ >0.05 ALB/(g/L) 34.04±14.59 33.82±14.72 34.53±14.28 0.87△ >0.05 BUN/(mmol/L) 5.58±2.74 5.62±2.81 5.50±2.58 0.11△ >0.05 SCr/(μmmol/L) 74.63±22.55 74.80±23.02 74.25±21.48 0.37△ >0.05 DDimer/(mg/L) 1.02±1.40 0.97±1.23 1.12±1.71 0.59△ >0.05 INR 1.08±0.32 1.07±0.31 1.09±0.35 0.93△ >0.05 PCT/(ng/mL) 0.58±1.34 0.60±1.33 0.54±1.35 1.78△ >0.05 CRP/(mg/dL) 40.33±29.05 41.43±29.90 37.84±26.88 1.80△ >0.05 *示t值;△示Z值  下载: 导出CSV
表 2 支持向量机模型与logisitc回归模型的ROC曲线的参数
模型 ROC曲线下面积 敏感性/% 特异性/% 准确率/% 阳性预测值/% 阴性预测值/% 支持向量机模型(训练集) 0.97 68.57 97.44 95.52 80.00 97.74 logistic模型(训练集) 0.95 62.86 98.88 96.47 65.75 97.38 支持向量机模型(验证集) 0.98 79.78 98.33 96.34 83.33 97.63 logistic模型(验证集) 0.91 77.78 99.05 96.98 77.13 99.05
下载: 导出CSV
-
[1] BURG ML, DANESHMAND S. Frailty and preoperative risk assessment before radical cystectomy[J]. Curr Opin Urol, 2019, 29(3): 216. doi: 10.1097/MOU.0000000000000616 [2] MATSUMOTO S, TAKAYAMA T, WAKATSUKI K, et al. Preoperative cardiac risk assessment and surgical outcomes of patients with gastric cancer[J]. Ann Surg Oncol, 2016, 23(Suppl 2): S222. [3] LEYH-BANNURAH SR, DELL'OGLIO P, ZAFFUTO E, et al. Assessment of oncological outcomes after radical prostatectomy according to preoperative and postoperative cancer of the prostate risk assessment scores: results from a large, two-center experience[J]. Eur Urol Focus, 2019, 5(4): 568. doi: 10.1016/j.euf.2017.10.015 [4] GUO R, YU W, MENG Y, et al. Correlation of ASA Grade and the Charlson Comorbidity Index With Complications in Patients After Transurethral Resection of Prostate[J]. Urology, 2016, 98: 120. doi: 10.1016/j.urology.2016.07.025 [5] LAMBDEN S, LATERRE PF, LEVY MM, et al. The SOFA score-development, utility and challenges of accurate assessment in clinical trials[J]. Crit Care, 2019, 23(1): 374. doi: 10.1186/s13054-019-2663-7 [6] HANSTED AK, MØLLER MH, MØLLER AM, et al. APACHE Ⅱ score validation in emergency abdominal surgery. A post hoc analysis of the InCare trial[J]. Acta Anaesthesiol Scand, 2020, 64(2): 180. doi: 10.1111/aas.13476 [7] AUCOIN S, MCISAAC DI. Emergency general surgery in older adults: a review[J]. Anesthesiol Clin, 2019, 37(3): 493. doi: 10.1016/j.anclin.2019.04.008 [8] HUANG S, YANG J, FONG S, et al. Artificial intelligence in cancer diagnosis and prognosis: Opportunities and challenges[J]. Cancer Lett, 2020, 471: 61. doi: 10.1016/j.canlet.2019.12.007 [9] LI B, DING S, SONG G, et al. Computer-aided diagnosis and clinical trials of cardiovascular diseases based on artificial intelligence technologies for risk-early warning model[J]. J Med Syst, 2019, 43(7): 228. doi: 10.1007/s10916-019-1346-x [10] KIM J, CHAE M, CHANG HJ, et al. Predicting Cardiac Arrest and Respiratory Failure Using Feasible Artificial Intelligence with Simple Trajectories of Patient Data[J]. J Clin Med, 2019, 8(9): 1336. doi: 10.3390/jcm8091336 [11] JIANG H, GU J, DU J, et al. A 21-gene Support Vector Machine classifier and a 10-gene risk score system constructed for patients with gastric cancer[J]. Mol Med Rep, 2020, 21(1): 347. [12] GOLPOUR P, GHAYOUR-MOBARHAN M, SAKI A, et al. Comparison of Support Vector Machine, NaÏve Bayes and Logistic Regression for Assessing the Necessity for Coronary Angiography[J]. Int J Environ Res Public Health, 2020, 17(18): 6449. doi: 10.3390/ijerph17186449 [13] OBUCHOWSKI NA, BULLEN JA. Receiver operating characteristic (ROC) curves: review of methods with applications in diagnostic medicine[J]. Phys Med Biol, 2018, 63(7): 07TR01. [14] CARTER JV, PAN J, RAI SN, et al. ROC-ing along: Evaluation and interpretation of receiver operating characteristic curves[J]. Surgery, 2016, 159(6): 1638. doi: 10.1016/j.surg.2015.12.029 [15] MEURER WJ, TOLLES J. Logistic Regression Diagnostics: Understanding How Well a Model Predicts Outcomes[J]. JAMA, 2017, 317(10): 1068. doi: 10.1001/jama.2016.20441 [16] DE BOVES HARRINGTON P. Support vector machine classification trees based on fuzzy entropy of classification[J]. Anal Chim Acta, 2017, 954: 14. doi: 10.1016/j.aca.2016.11.072 [17] ING E, SU W, SCHONLAU M, et al. Support Vector Machines and logistic regression to predict temporal artery biopsy outcomes[J]. Can J Ophthalmol, 2019, 54(1): 116. doi: 10.1016/j.jcjo.2018.05.006 [18] CHEN K, LI R, DOU Y, et al. Ranking support vector machine with kernel approximation[J]. Comput Intell Neurosci, 2017, 2017: 4629534. [19] JIANG Y, XIE J, HAN Z, et al. Immunomarker support vector machine classifier for prediction of gastric cancer survival and adjuvant chemotherapeutic benefit[J]. Clin Cancer Res, 2018, 24(22): 5574. doi: 10.1158/1078-0432.CCR-18-0848 [20] ZHI J, SUN J, WANG Z, et al. Support vector machine classifier for prediction of the metastasis of colorectal cancer[J]. Int J Mol Med, 2018, 41(3): 1419. -

 点击查看大图
图(2)表(2)
计量
- 文章访问数: 2867
- HTML全文浏览量: 1767
- PDF下载量: 8
- 被引次数: 0
