

-
随着经济的发展、生活方式的改变以及人口寿命的延长,糖脂代谢紊乱、肥胖、骨质疏松已成为当今社会较为常见的慢性疾病,严重影响人民的健康和生活质量。研究[1]报道, 脂代谢与骨代谢二者常伴随出现,而调控血脂的一些药物(他汀类)能使骨质疏松病人骨折风险下降,而血脂异常的动脉硬化病人也常合并骨质疏松。血糖升高可引起渗透性利尿,钙、磷排泄增加,刺激甲状旁腺激素分泌,溶骨作用加强,导致骨密度(BMD)下降[2]。关于肥胖,常用的指标体质量指数(BMI)并不能准确反映人体脂肪的局部积累情况,而中国人群以腹部脂肪过度堆积导致的中心性肥胖居多,这种腹部脂肪的堆积可能与与骨质疏松的关系更为密切[3]。本研究通过定量CT(quantitative computed tomography,QCT)对健康体检人群腰椎MBD进行测量,旨在探讨血糖、血脂、腹部脂肪与BMD的关系,为预防和治疗骨质疏松提供科学依据。现作报道。
-
收集2019年8月至2020年1月在我院体检中心选择胸部低剂量CT联合骨密度QCT检查者。排除标准:(1)有胸腰段骨折史或椎体术后者;(2)既往患有骨代谢异常疾病(如肿瘤、甲亢、库欣综合征、肾性骨营养不良等)和服用影响骨代谢药物(如降钙素、皮质类固醇等)者。最终纳入1 161名受试者,其中男752名,女409名,年龄21~92岁。按照年龄分为20~、30~、40~、50~、60~、70~岁6个年龄段组。本研究经我院伦理委员会批审核通过(医伦理审查[2019]58号),受试者知情同意。
-
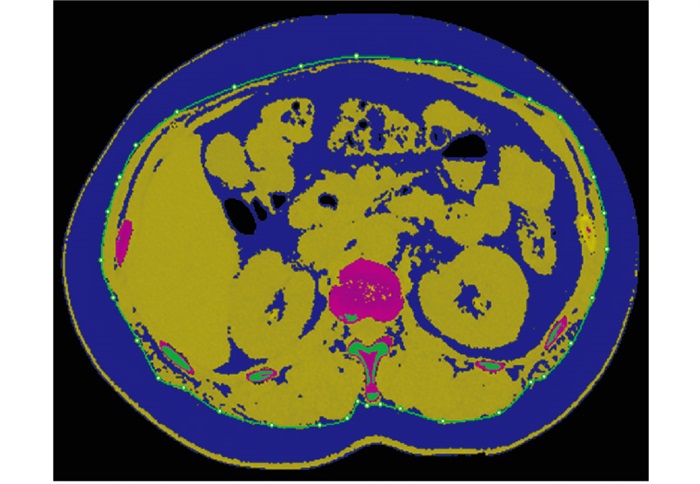
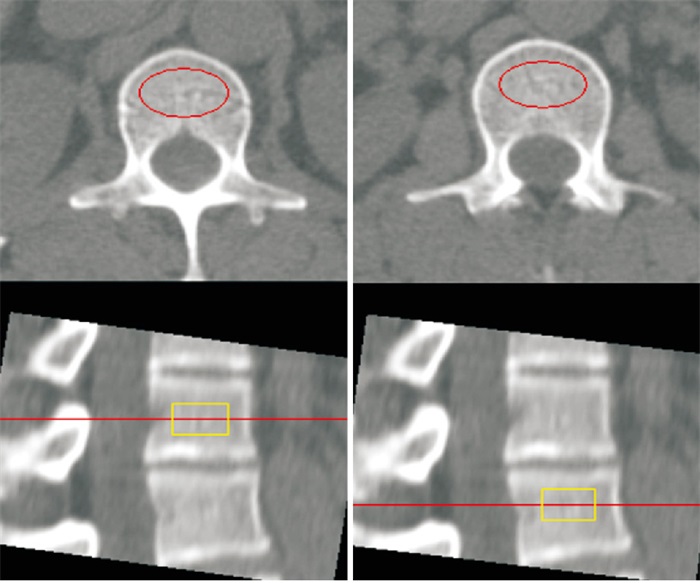
所有研究对象均采用东软128排螺旋CT进行胸部扫描。电压:120 kV,电流30 mAs,螺距0.775,旋转时间0.625 s,矩阵512×512,层厚及层间距均为5 mm,重建层厚及层间距均为1 mm。扫描范围由肺尖至L2椎体下缘。将CT扫描图像传输至QCT pro分析工作站,采用美国Mindways公司QCT BMD测量系统,对L1~L2椎体松质骨BMD进行测量,半自动设置感兴趣区(ROI),测量时注意避开边缘硬化区、骨岛或血管壁钙化(见图 1),取L1和L2平均值为最终腰椎BMD值。通过QCT骨密度分析软件中“tissue composition”模块测量L2中心层面腹部脂肪面积,以腹壁肌肉外缘界定腹内脂肪(visceral adipose tissue,VAT)与皮下脂肪(subcutaneous adipose tissue,SAT)(见图 2),软件自动得出腹部总脂肪(total adipose tissue,TAT)和VAT,两者相减得SAT。采用Hitachi全自动生化分析仪检测受试者空腹血糖、总胆固醇(total cholesterol,TC)、三酰甘油(triglyceride,TG)水平。

图 1 QCT测量L1、L2骨密度,红色椭圆为ROI横断位,黄色方框为ROI矢状位

图 2 QCT测量L2中心层面腹部脂肪,绿色光圈紧贴腹壁肌肉外缘,绿色光圈内蓝色为VAT,绿色光圈外蓝色为SAT
-
采用方差分析、q检验、Spearman相关分析和多因素线性回归分析。
-
不同年龄段男性的血糖、TC、TG、VAT、SAT、BMD间差异均有统计学意义(P < 0.05~P < 0.01)(见表 1)。不同年龄段女性的血糖、TC、TG、TAT、VAT、SAT、BMD间差异均有统计学意义(P < 0.01)(见表 2)。
年龄/岁 n BMD/(mg/cm3) TAT/cm2 VAT/cm2 SAT/cm2 血糖/(mmol/L) TG/(mmol/L) TC/(mmol/L) 20~ 49 169.39±22.56 248.31±139.44 135.61±81.77 112.7±68.00 4.65±0.40 1.28±0.97 4.22±0.99 30~ 97 165.08±32.42 258.98±108.73 164.08±72.56 109.17±64.65 4.87±0.48 1.39±1.12 4.57±0.78 40~ 135 145.50±27.65 260.81±114.20 191.62±75.68*△ 120.30±87.25 5.43±1.51*△ 1.40±0.79 4.62±0.80 50~ 220 136.07±32.25*△ 251.67±244.26 189.47±82.90*△ 140.32±221.51*△ 5.39±1.32*△ 1.73±1.38*△# 4.64±0.91* 60~ 124 140.45±171.03*△ 223.89±122.23 192.22±84.29*△ 139.25±107.38*△ 5.53±1.39*△ 1.76±1.91*△# 4.80±1.01*△ 70~ 127 99.00±31.41*△# 212.34±130.22 201.32±91.07*△ 172.83±131.49*△# 5.47±1.13*△ 1.86±1.76*△# 4.89±0.95*△ F — 11.49 1.79 6.32 2.87 7.05 3.65 8.17 P — < 0.01 >0.05 < 0.01 < 0.05 < 0.01 < 0.01 < 0.01 MS组内 — 79 268.841 3 467.233 32 156.822 18 673.347 12.332 8.353 10.894 q检验:与20~岁组比较*P < 0.05;与30~岁组比较△P < 0.05;与40~岁组比较#P < 0.05 表 1 不同年龄男性受试者相关指标比较(x±s)
年龄/岁 n BMD/(mg/cm3) TAT/cm2 VAT/cm2 SAT/cm2 血糖/(mmol/L) TG/(mmol/L) TC/(mmol/L) 20~ 51 181.48±30.67 152.92±96.95 53.50±43.22 100.88±62.22 4.70±0.42 0.86±0.41 4.05±0.81 30~ 65 176.35±39.02 168.81±97.56 70.22±51.31* 98.60±55.83 4.81±0.68 1.15±0.83 4.32±1.17 40~ 79 167.46±34.73 197.22±105.45*△ 88.49±65.86* 124.12±70.16△ 4.79±0.41 1.22±0.54* 4.99±1.12*△ 50~ 107 134.02±35.91* 206.47±83.45*△ 100.34±50.80* 145.67±64.59*△ 4.95±0.81 1.41±1.15*△ 4.98±0.96*△ 60~ 69 102.17±27.80*△# 235.32±110.86*△ 134.74±66.07*△# 165.33±88.21*△# 5.31±1.32*△# 1.36±1.10* 5.00±0.99*△ 70~ 38 77.66±32.29*△#▲ 212.87±108.68*△ 131.92±55.95*△#▲ 165.69±93.54*△# 5.70±2.29*△#▲ 1.53±0.89*△ 5.00±1.02*△ F — 82.36 5.52 18.45 10.33 6.66 3.80 10.25 P — < 0.01 < 0.01 < 0.01 < 0.01 < 0.01 < 0.01 < 0.01 MS组内 — 621 453.523 123 477.362 135 871.251 273 921.281 11.793 8.592 13.744 q检验:与20~岁组比较*P < 0.05;与30~岁组比较△P < 0.05;与40~岁组比较#P < 0.05;与50~岁组比较▲P < 0.05 表 2 不同年龄女性受试者相关指标比较(x±s)
-
男性血糖、TC、TG、VAT、SAT与BMD均呈负相关关系(P < 0.05~P < 0.01),TAT与BMD无明显相关关系(P>0.05);女性血糖、TC、TG、TAT、VAT、SAT与BMD均呈明显负相关关系(P < 0.01)(见表 3)。
性别 TAT VAT SAT TG TC 血糖 男 0.007 -0.196** -0.162** -0.082* -0.089** -0.151** 女 -0.316** -0.475** -0.391** -0.244** -0.309** -0.217** *P < 0.05,**P < 0.01 表 3 腹部脂肪、血脂、血糖与BMD的相关性分析(rs)
-
以BMD为因变量,以血糖、TC、TG、TAT、VAT、SAT为自变量(赋值为实际水平),进行多元线性回归分析。结果显示,VAT、血糖均为男性BMD的独立影响因素(P < 0.01和P < 0.05);TC、VAT均为女性BMD的独立影响因素(P < 0.01)(见表 4)。
分组 变量 B SE β t P 男性 常量 127.892 12.730 — 10.05 < 0.01 VAT -0.093 0.035 -0.117 -2.68 < 0.01 血糖 5.183 2.333 0.165 2.22 < 0.05 TAT 0.044 0.028 0.016 2.19 >0.05 SAT -0.037 0.021 -0.046 -0.07 >0.05 TC -2.297 3.075 -0.084 -0.75 >0.05 TG 1.964 2.002 0.037 0.98 >0.05 女性 常量 217.163 9.617 — 22.58 < 0.01 VAT -0.307 0.034 -0.425 -8.97 < 0.01 TC -9.438 1.972 -0.327 -4.79 < 0.01 TAT 0.022 0.031 0.003 0.72 >0.05 SAT -0.056 0.036 -0.095 -1.56 >0.05 血糖 -4.246 2.057 -0.147 -2.06 >0.05 TG 2.502 2.457 0.039 1.07 >0.05 表 4 不同性别受试者腰椎BMD影响因素的多元线性回归分析
-
QCT是作为一种三维体积BMD测量技术,可以将感兴趣区放在椎体中央,避开大动脉钙化、骨质增生硬化部分,因此具有较高敏感度和准确率,目前多与低剂量胸部CT扫描同步进行,可在不增加辐射剂量和扫描时间的同时,较为精准地测量腰椎BMD[4]。相较于双能X线吸收检测法平面投影容易出现较大误差的不足,QCT目前已逐渐成为测量BMD的主要检查手段。
研究[5]显示,糖基化终末产物、糖化血红蛋白的过度生成可诱导成骨细胞凋亡、抑制成骨细胞分化,从而引起BMD下降。也有报道[6]称,胰岛素分泌不足会引起成骨细胞无法接受到足够的信号刺激,胶原、骨基质合成减少,从而造成BMD下降。余萍萍等[7]通过双能X线吸收检测法测量BMD,结果显示女性空腹血糖与BMD下降存在相关关系。本研究结果通过胸部低剂量CT联合QCT测量腰椎BMD,结果显示不同性别空腹血糖与腰椎BMD均呈负相关关系;多元线性回归结果显示,血糖是男性BMD下降的危险因素,与文献报道略有不同,可能是由于样本量不同以及选择BMD测量方法不同所致。
近年研究[8]报道,成骨细胞、软骨细胞和脂肪细胞均由骨髓的基质细胞分化而来,分化方向由Wnt/β-catenin信号通路调控,因此Wnt通路一旦被阻断,骨髓基质细胞主要向脂肪细胞分化,这就是脂肪代谢与骨代谢相关并能够相互调控的重要生理基础。而脂代谢紊乱与骨质疏松内在联系的具体机制尚不清楚,目前国内外关于血脂和骨质疏松关系的报道结果并不完全一致。GO等[9]研究发现,绝经后女性腰椎BMD与TC、LDL-C及HDL-C均无相关关系。胡琴等[10]通过QCT测量不同性别中老年人腰椎BMD,研究其与血脂的相关性,结果表明男性腰椎BMD与HDL-C呈负相关关系,女性腰椎BMD与TC、TG及LDL-C均呈负相关关系。CUI等[11]报道称,不同性别腰椎BMD与HDL-C均呈负相关关系。本研究结果显示,不同性别腰椎BMD与TC、TG均呈轻度负相关关系。虽然各报道略有出入,但多数学者认为血脂代谢的异常与BMD下降有一定关联性,仍需进一步探索研究。
肥胖被认为是影响BMD的重要因素,与骨质疏松的发生有着错综复杂的关系,常用于评价肥胖的指标包括体质量、腰围、臀围、BMI等,但各指标均存在一定的片面性,近些年来腹部脂肪含量日渐备受关注。WANG等[12]采用QCT测量女性L4中心层面腹部脂肪和腰椎BMD,发现TAT、VAT、SAT与BMD均呈负相关关系,校正年龄、BMI因素后,VAT是女性BMD的独立负性影响因素。潘亚玲等[13]研究结果显示,腹部脂肪和BMD随年龄发生变化,男性和女性均在40~59岁出现VAT明显增多,VAT可能是女性BMD的独立负性影响因素。刘正华等[14]报道,女性脐水平脂肪面积、内脏脂肪面积与腰椎BMD均呈负相关关系。本研究中,将1 161名体检者分为不同性别、不同年龄段组分别比较,结果发现不同性别、不同年龄段的TAT、VAT、SAT间差异具有统计学意义,男性VAT、SAT与BMD呈轻度负相关关系,女性血糖TAT、VAT、SAT与BMD均呈负相关关系,进一步多元线性回归结果显示,VAT是不同性别BMD下降的危险因素,与潘玲等[13]报道VAT仅是女性BMD的负性危险因素略有出入,系研究人群不同,或与本研究中测量的均为相应层面脂肪面积有关,后期将进一步进行对比探索。
综上,血糖、血脂代谢异常及腹部脂肪含量均与BMD有一定关系,血糖可能是男性BMD的负性影响因素,TC可能是女性BMD的负性影响因素,而腹内脂肪含量对不同性别BMD均有负性影响,因此,可注重血糖、血脂及腹内脂肪的含量检测。同时本研究仍有不足之处,如研究对象仅为体检者且样本量相对较小,不能反映自然人群整体情况;本研究为单中心研究,地域性可能会影响研究结果,后期须进一步扩大样本量及行多中心临床研究验证。
基于定量CT分析血糖、血脂、腹部脂肪与骨密度的关系
Study on the relationship between the blood glucose, blood lipid, abdominal fat, and bone mineral density based on the quantitative CT
-
摘要:
目的采用定量CT(QCT)探讨血糖、血脂及腹部脂肪与骨密度(BMD)的关系。 方法选取行低剂量胸部CT联合QCT检查的健康体检者1161名, 其中男752名, 女409名, 根据年龄分为20~、30~、40~、50~、60~、70~岁6个年龄段。空腹采集受检者静脉血, 检测血糖、总胆固醇(TC)、三酰甘油(TG)。采用QCT测量L2中心水平层面腹部总脂肪(TAT)、腹内脂肪(VAT)、皮下脂肪(SAT)及腰椎BMD。 结果男性不同年龄段组血糖、TC、TG、VAT、SAT、BMD间差异均有统计学意义(P < 0.05~P < 0.01), 女性不同年龄段组血糖、TC、TG、TAT、VAT、SAT、BMD间差异均有统计学意义(P < 0.01)。男性血糖、TC、TG、VAT、SAT与BMD均呈负相关关系(P < 0.05~P < 0.01), 女性血糖、TC、TG、TAT、VAT、SAT与BMD均呈负相关关系(P < 0.01)。多元线性回归分析显示, 血糖、VAT均为男性BMD的独立影响因素(P < 0.05和P < 0.01);TC、VAT均为女性BMD的独立影响因素(P < 0.01)。 结论血糖可能是男性BMD的负性影响因素, TC可能是女性BMD的负性影响因素, 而VAT对不同性别BMD均有负性影响。 Abstract:ObjectiveTo explore the relationship between the blood glucose, blood lipids, abdominal fat, and bone mineral density(BMD) using quantitative computed tomography(QCT). MethodsA total of 1161 healthy subjects(including 752 males and 409 females) detected by low-dose chest CT combined with QCT were selected, and divided into the 20-29, 30-39, 40-49, 50-59, 60-69 and ≥70 years old six age groups.The venous blood of all subjects were collected on an empty stomach for detecting the levels of blood glucose, total cholesterol(TC) and triglyceride(TG).The QCT was used to measure the total adipose tissue(TAT), visceral adipose tissue(VAT), subcutaneous adipose tissue(SAT) and lumbar BMD at the central level of L2. ResultsThe differences of the levels of blood glucose, TC, TG, VAT, SAT and BMD among different age groups in male were statistically significant(P < 0.05 to P < 0.01), and the differences of which among different age groups in female were statistically significant(P < 0.01).The levels of the blood glucose, TC, TG, VAT and SAT were negatively correlatied with BMD in male(P < 0.05 to P < 0.01), and the levels of blood glucose, TC, TG, TAT, VAT and SAT were negatively correlated with BMD in female(P < 0.01).The results of multiple linear regression analysis showed that the blood glucose and VAT were the independent influencing factors of male BMD(P < 0.05 and P < 0.01), and the levels of TC and VAT were the independent influencing factors of female BMD(P < 0.01). ConclusionsThe blood glucose may be a negative influencing factor of male BMD, the TC may be a negative influencing factor of female BMD, and the VAT has a negative effect on BMD of different genders. -
Key words:
- quantitative computed tomography /
- bone mineral density /
- blood glucose /
- blood lipid
-
表 1 不同年龄男性受试者相关指标比较(x±s)
年龄/岁 n BMD/(mg/cm3) TAT/cm2 VAT/cm2 SAT/cm2 血糖/(mmol/L) TG/(mmol/L) TC/(mmol/L) 20~ 49 169.39±22.56 248.31±139.44 135.61±81.77 112.7±68.00 4.65±0.40 1.28±0.97 4.22±0.99 30~ 97 165.08±32.42 258.98±108.73 164.08±72.56 109.17±64.65 4.87±0.48 1.39±1.12 4.57±0.78 40~ 135 145.50±27.65 260.81±114.20 191.62±75.68*△ 120.30±87.25 5.43±1.51*△ 1.40±0.79 4.62±0.80 50~ 220 136.07±32.25*△ 251.67±244.26 189.47±82.90*△ 140.32±221.51*△ 5.39±1.32*△ 1.73±1.38*△# 4.64±0.91* 60~ 124 140.45±171.03*△ 223.89±122.23 192.22±84.29*△ 139.25±107.38*△ 5.53±1.39*△ 1.76±1.91*△# 4.80±1.01*△ 70~ 127 99.00±31.41*△# 212.34±130.22 201.32±91.07*△ 172.83±131.49*△# 5.47±1.13*△ 1.86±1.76*△# 4.89±0.95*△ F — 11.49 1.79 6.32 2.87 7.05 3.65 8.17 P — < 0.01 >0.05 < 0.01 < 0.05 < 0.01 < 0.01 < 0.01 MS组内 — 79 268.841 3 467.233 32 156.822 18 673.347 12.332 8.353 10.894 q检验:与20~岁组比较*P < 0.05;与30~岁组比较△P < 0.05;与40~岁组比较#P < 0.05  下载: 导出CSV
表 2 不同年龄女性受试者相关指标比较(x±s)
年龄/岁 n BMD/(mg/cm3) TAT/cm2 VAT/cm2 SAT/cm2 血糖/(mmol/L) TG/(mmol/L) TC/(mmol/L) 20~ 51 181.48±30.67 152.92±96.95 53.50±43.22 100.88±62.22 4.70±0.42 0.86±0.41 4.05±0.81 30~ 65 176.35±39.02 168.81±97.56 70.22±51.31* 98.60±55.83 4.81±0.68 1.15±0.83 4.32±1.17 40~ 79 167.46±34.73 197.22±105.45*△ 88.49±65.86* 124.12±70.16△ 4.79±0.41 1.22±0.54* 4.99±1.12*△ 50~ 107 134.02±35.91* 206.47±83.45*△ 100.34±50.80* 145.67±64.59*△ 4.95±0.81 1.41±1.15*△ 4.98±0.96*△ 60~ 69 102.17±27.80*△# 235.32±110.86*△ 134.74±66.07*△# 165.33±88.21*△# 5.31±1.32*△# 1.36±1.10* 5.00±0.99*△ 70~ 38 77.66±32.29*△#▲ 212.87±108.68*△ 131.92±55.95*△#▲ 165.69±93.54*△# 5.70±2.29*△#▲ 1.53±0.89*△ 5.00±1.02*△ F — 82.36 5.52 18.45 10.33 6.66 3.80 10.25 P — < 0.01 < 0.01 < 0.01 < 0.01 < 0.01 < 0.01 < 0.01 MS组内 — 621 453.523 123 477.362 135 871.251 273 921.281 11.793 8.592 13.744 q检验:与20~岁组比较*P < 0.05;与30~岁组比较△P < 0.05;与40~岁组比较#P < 0.05;与50~岁组比较▲P < 0.05
下载: 导出CSV
表 3 腹部脂肪、血脂、血糖与BMD的相关性分析(rs)
性别 TAT VAT SAT TG TC 血糖 男 0.007 -0.196** -0.162** -0.082* -0.089** -0.151** 女 -0.316** -0.475** -0.391** -0.244** -0.309** -0.217** *P < 0.05,**P < 0.01
下载: 导出CSV
表 4 不同性别受试者腰椎BMD影响因素的多元线性回归分析
分组 变量 B SE β t P 男性 常量 127.892 12.730 — 10.05 < 0.01 VAT -0.093 0.035 -0.117 -2.68 < 0.01 血糖 5.183 2.333 0.165 2.22 < 0.05 TAT 0.044 0.028 0.016 2.19 >0.05 SAT -0.037 0.021 -0.046 -0.07 >0.05 TC -2.297 3.075 -0.084 -0.75 >0.05 TG 1.964 2.002 0.037 0.98 >0.05 女性 常量 217.163 9.617 — 22.58 < 0.01 VAT -0.307 0.034 -0.425 -8.97 < 0.01 TC -9.438 1.972 -0.327 -4.79 < 0.01 TAT 0.022 0.031 0.003 0.72 >0.05 SAT -0.056 0.036 -0.095 -1.56 >0.05 血糖 -4.246 2.057 -0.147 -2.06 >0.05 TG 2.502 2.457 0.039 1.07 >0.05
下载: 导出CSV
-
[1] BLACK AJ, RAVI S, JEFFERSON LS, et al. Dietary fat quantity and type induce transcriptome-wide effects on alternative splicing of pre-mRNA in rat skeletal muscle[J]. J Nutr, 2017, 147(9): 1648. [2] DEVLIN MJ, ROSEN CJ. The bone-fat interface: basic and clinical implications of marrow adiposity[J]. Lancet Diabetes Endocrinol, 2015, 3(2): 141. doi: 10.1016/S2213-8587(14)70007-5 [3] CHENG XG, LI K, OU SX, et al. Heterogeneity in spinal bone mineral density among young adults from three astern provincial capital cities in mainland china[J]. J Clin Densitom, 2017, 20(2): 198. doi: 10.1016/j.jocd.2016.03.009 [4] 王勇朋, 阳琰, 何生生, 等. 低剂量胸部CT与QCT椎体骨密度测量一站式扫描可行性研究[J]. 放射学实践, 2018, 33(11): 1194. [5] FEIGH M, ANDREASSEN KV, HJULER ST, et al. Oral salmon calcitonin protects against impaired fasting glycemia, glucose intolerance, and obesity induced by high-fat diet and ovariectomy in rats[J]. Menopause. 2013, 20(7): 785. doi: 10.1097/GME.0b013e31827c58ab [6] 胡倩, 周琼, 李军, 等. Wnt信号通路中DKK1、β-catenin基因在绝经后女性2型糖尿病患者中的表达及与骨代谢关系的研究[J]. 中国骨质疏松杂志, 2018, 24(11): 1459. doi: 10.3969/j.issn.1006-7108.2018.11.013 [7] 余萍萍, 何丽, 王斯瑶, 等. 不同性别骨密度与血脂、血糖、血压的相关性研究[J]. 重庆医学, 2018, 47(23): 3077. doi: 10.3969/j.issn.1671-8348.2018.23.020 [8] CHENG X, ZHANG Y, WANG C, et al. The optimal anatomic site for a single slice to estimate the total volume of visceral adipose tissue by using the quantitative computed tomography(QCT) in Chinese population[J]. Eur J Clin Nutr, 2018, 72(11): 1567. doi: 10.1038/s41430-018-0122-1 [9] GO JH, SONG YM, PARK JH, et al. Association between serum cholesterol level and bone mineral density at lumbar spine and femur neck in postmenopausal Korean women[J]. Korean J Fam Med, 2012, 33(3): 166. doi: 10.4082/kjfm.2012.33.3.166 [10] 胡琴, 翟建, 吴雅琳, 等. 基于定量CT分析不同性别腰椎骨密度和血脂的相关性[J]. 中国医学影像技术, 2019, 35(9): 1396. [11] CUI R, ZHOU L, LI Z, et al. Assessment risk of osteoporosis in Chinese people: relationship among body mass index, serum lipid profiles, blood glucose, and bone mineral density[J]. Clin Interv Aging, 2016, 11: 887. doi: 10.2147/CIA.S103845 [12] WANG L, WANG W, XU L, et al. Relation of visceral and subcutaneous adipose tissue to bone mineral density in Chinese women[J]. Int J Endocrinol, 2013, 23: 1. [13] 潘亚玲, 陈彤彤, 王晗琦, 等. 定量CT分析年龄、腹部脂肪与骨密度的关系[J]. 中国医学影像学杂志, 2020, 28(4): 276. doi: 10.3969/j.issn.1005-5185.2020.04.010 [14] 刘正华, 张玉婷, 孔江涛, 等. 年龄分层在女性腰椎骨密度与肥胖相关研究中的必要性[J]. 实用放射学杂志, 2020, 36(2): 259. doi: 10.3969/j.issn.1002-1671.2020.02.022 -

 点击查看大图
图(2)表(4)
计量
- 文章访问数: 2461
- HTML全文浏览量: 1342
- PDF下载量: 5
- 被引次数: 0
