• 中国科技论文统计源期刊
  • 中国科技核心期刊
  • 中国高校优秀期刊
  • 安徽省优秀科技期刊
Volume 49 Issue 1
Jan.  2024
Article Contents
Turn off MathJax

Citation:

Analysis of the difference of thoracolumbar vertebral bone mineral density between type 2 diabetes mellitus population and normal population

  • Corresponding author: WANG Zhongqiu, zhq2001us@163.com
  • Received Date: 2022-07-21
    Accepted Date: 2022-11-11
  • ObjectiveTo investigate the distribution difference of thoracolumbar vertebral bone mineral density (BMD) between type 2 diabetes mellitus (T2DM) patients and normal population.MethodsSixty-eight T2DM patients were selected as the observation group, and 96 health examinees at the same period were selected as the control group.BMD of T11-L4 vertebral body was measured based on quantitative CT.The two groups were divided into different subgroups according to body mass index (BMI), age and sex.The general data of the two groups, incidence of thoracolumbar vertebral osteoporosis (OP) in different age groups, thoracolumbar vertebral BMD in different BMI groups and thoracolumbar vertebral BMD in different sex groups were compared.ResultsThe BMI and fasting blood glucose of patients in the observation group were higher than those in the control group (P < 0.05 and P < 0.01).The thoracolumbar vertebral BMD of the subjects in the two groups showed a gradual downward trend, and the BMD of the T11-L4 vertebrae in the observation group was lower than that in the control group (P < 0.05 to P < 0.01).With the increase of age, the incidence of OP in T11-L2 vertebrae in the two groups increased (P < 0.01).When BMI < 24 kg/m2, the thoracolumbar vertebral BMD in the observation group was lower than that in the control group (P < 0.05).In the female group, the thoracolumbar vertebral BMD in the observation group was lower than that in the control group (P < 0.05 to P < 0.01);in the male group, there was no significant difference in thoracolumbar vertebral BMD between the two groups (P>0.05).ConclusionsWith the increase of age, thoracolumbar vertebral BMD decreases in both T2DM patients and normal population, which is related to sex and BMI, and T2DM patients are more likely to suffer OP.Therefore, T2DM patients should strengthen the relevant examination of vertebral BMD, and take measures to alleviate bone loss and prevent the occurrence of OP as soon as possible.
  • 加载中
  • [1] TONNIES T, RATHMANN W, HOYER A, et al. Quantifying the underestimation of projected global diabetes prevalence by the International Diabetes Federation (IDF) Diabetes Atlas[J]. BMJ Open Diabetes Res Care, 2021, 9(1): e002122. doi: 10.1136/bmjdrc-2021-002122
    [2] LU YH, GU L, JIANG Y. Positive association of fasting plasma glucose with bone mineral density in non-diabetic elderly females[J]. J Bone Miner Metab, 2022, 40(5): 755. doi: 10.1007/s00774-022-01341-7
    [3] 蹇新梅, 宋玲玲, 杜霞, 等. 定量CT(QCT)测定健康体检者胸腰椎骨密度分布规律及其相关性[J]. 中国骨质疏松杂志, 2021, 27(10): 1499.
    [4] OEI L, KOROMANI F, BREDA SJ, et al. Osteoporotic vertebral fracture prevalence varies widely between qualitative and quantitative radiological assessment methods: the Rotterdam study[J]. J Bone Miner Res, 2018, 33(4): 560. doi: 10.1002/jbmr.3220
    [5] American Diabetes Association. Classification and diagnosis of diabetes: standards of medical care in diabetes-2020[J]. Diabetes Care, 2020, 43(Suppl 1): S14.
    [6] 程晓光, 王亮, 曾强, 等. 中国定量CT(QCT)骨质疏松症诊断指南(2018)[J]. 中国骨质疏松杂志, 2019, 25(6): 733.
    [7] HOFBAUER LC, BUSSE B, EASTELL R, et al. Bone fragility in diabetes: novel concepts and clinical implications[J]. Lancet Diabetes Endocrinol, 2022, 10(3): 207. doi: 10.1016/S2213-8587(21)00347-8
    [8] ABDULAMEER SA, SULAIMAN SA, HASSALI MA, et al. Osteoporosis and type 2 diabetes mellitus: what do we know, and what we can do?[J]. Patient Prefer Adherence, 2012, 6: 435.
    [9] FUGGLE NR, CURTIS EM, WARD KA, et al. Fracture prediction, imaging and screening in osteoporosis[J]. Nat Rev Endocrinol, 2019, 15(9): 535. doi: 10.1038/s41574-019-0220-8
    [10] 余卫, 夏维波, 王青松, 等. 双能X线骨密度测量仪测量报告的影像分析及其质量评估[J]. 中华骨质疏松和骨矿盐疾病杂志, 2015, 8(4): 312.
    [11] LAU EM, LEUNG PC, KWOK T, et al. The determinants of bone mineral density in Chinese men—results from Mr. Os (Hong Kong), the first cohort study on osteoporosis in Asian men[J]. Osteoporos Int, 2006, 17(2): 297. doi: 10.1007/s00198-005-2019-9
    [12] VIGEVANO F, GREGORI G, COLLELUORI G, et al. In men with obesity, T2DM is associated with poor trabecular microarchitecture and bone strength and low bone turnover[J]. J Clin Endocrinol Metab, 2021, 106(5): 1362. doi: 10.1210/clinem/dgab061
    [13] ZHOU Y, LI Y, ZHANG D, et al. Prevalence and predictors of osteopenia and osteoporosis in postmenopausal Chinese women with type 2 diabetes[J]. Diabetes Res Clin Pract, 2010, 90(3): 261. doi: 10.1016/j.diabres.2010.09.013
    [14] LI W, LI C, ZHOU X, et al. Relationship between GDF15 level and bone metabolism in postmenopausal Chinese women[J]. Gynecol Endocrinol, 2020, 36(8): 714. doi: 10.1080/09513590.2020.1764929
    [15] FISHER A, SRIKUSALANUKUL W, FISHER L, et al. Lower serum P1NP/βCTX ratio and hypoalbuminemia are independently associated with osteoporotic nonvertebral fractures in older adults[J]. Clin Interv Aging, 2017, 12(11): 1131.
  • 加载中
通讯作者: 陈斌, bchen63@163.com
  • 1. 

    沈阳化工大学材料科学与工程学院 沈阳 110142

  1. 本站搜索
  2. 百度学术搜索
  3. 万方数据库搜索
  4. CNKI搜索

Figures(1) / Tables(4)

Article views(1733) PDF downloads(10) Cited by()

Related
Proportional views

Analysis of the difference of thoracolumbar vertebral bone mineral density between type 2 diabetes mellitus population and normal population

    Corresponding author: WANG Zhongqiu, zhq2001us@163.com
  • 1. School of Laboratory Medicine, Bengbu Medical University, Bengbu Anhui 233030
  • 2. Department of Radiology, Affiliated Hospital of Nanjing University of Chinese Medicine, Jiangsu Hospital of Traditional Chinese Medicine, Nanjing Jiangsu 210029, China

Abstract: ObjectiveTo investigate the distribution difference of thoracolumbar vertebral bone mineral density (BMD) between type 2 diabetes mellitus (T2DM) patients and normal population.MethodsSixty-eight T2DM patients were selected as the observation group, and 96 health examinees at the same period were selected as the control group.BMD of T11-L4 vertebral body was measured based on quantitative CT.The two groups were divided into different subgroups according to body mass index (BMI), age and sex.The general data of the two groups, incidence of thoracolumbar vertebral osteoporosis (OP) in different age groups, thoracolumbar vertebral BMD in different BMI groups and thoracolumbar vertebral BMD in different sex groups were compared.ResultsThe BMI and fasting blood glucose of patients in the observation group were higher than those in the control group (P < 0.05 and P < 0.01).The thoracolumbar vertebral BMD of the subjects in the two groups showed a gradual downward trend, and the BMD of the T11-L4 vertebrae in the observation group was lower than that in the control group (P < 0.05 to P < 0.01).With the increase of age, the incidence of OP in T11-L2 vertebrae in the two groups increased (P < 0.01).When BMI < 24 kg/m2, the thoracolumbar vertebral BMD in the observation group was lower than that in the control group (P < 0.05).In the female group, the thoracolumbar vertebral BMD in the observation group was lower than that in the control group (P < 0.05 to P < 0.01);in the male group, there was no significant difference in thoracolumbar vertebral BMD between the two groups (P>0.05).ConclusionsWith the increase of age, thoracolumbar vertebral BMD decreases in both T2DM patients and normal population, which is related to sex and BMI, and T2DM patients are more likely to suffer OP.Therefore, T2DM patients should strengthen the relevant examination of vertebral BMD, and take measures to alleviate bone loss and prevent the occurrence of OP as soon as possible.

  • 随着人口老龄化进程加快,骨质疏松症(osteoporosis, OP)和2型糖尿病病人(type 2 diabetes mellitus,T2DM)发病率逐年升高。在糖尿病的发生发展过程中,也伴随骨代谢的异常[1]。糖尿病所引发的骨质疏松可能与T2DM病人处于高血糖状态、体内胰岛素的缺乏、脂质代谢紊乱及炎症因子所引起的破骨细胞活动增强等有关[2]。已有研究[3]发现,胸腰椎交界处因椎体活动度大,是骨折的好发部位,其中,胸腰段椎体常指T11~L2。糖尿病所引起的椎体骨折,会引发严重的并发症,其致死、致残率较高[4]。因此,本研究通过定量CT(quantitative CT,QCT)测量胸T11~L4椎体的骨密度(bone mineral density,BMD),探讨T2DM病人胸腰椎BMD与正常人群胸腰椎BMD的差异及OP检出率,为糖尿病性OP提供更好的防治依据。

1.   资料与方法
  • 选取2021年3-12月在江苏省中医院住院治疗的T2DM病人68例作为观察组。排除标准: (1)排除1型、2型及特殊类型糖尿病;(2)临床资料不全且未做QCT BMD检查的病人;(3)其余同T2DM病人的排除标准。纳入标准: (1)符合2020年美国糖尿病学会诊断为T2DM的标准(或已经确诊为T2DM病人);(2)进行常规的实验室检查[空腹血糖(fasting blood glucose,FBG)或糖化血红蛋白]且临床基线资料完整;(3)所有T2DM病人均进行QCT BMD检查。排除标准: (1)排除严重肾功能障碍,合并糖尿病急性并发症;(2)恶性肿瘤、甲状旁腺疾病、垂体疾病等影响骨代谢的病人;(3)骨关节疾病、椎体压缩性骨折、椎体有病变(如: 椎管淋巴瘤、转移瘤、椎体血管瘤等疾病)等影响BMD测量的病人;(4)心功能不全、心绞痛、心肌梗死等疾病;(5)合并风湿性疾病,或内分泌系统其他疾病,如结缔组织病、系统性红斑狼疮、性腺功能异常等疾病;(6)曾经服用过影响骨代谢的药物,如皮质类固醇激素、雌激素、钙剂、维生素D等;(7)年龄 < 20岁或>70岁的病人。糖尿病诊断标准: 采用2020年美国糖尿病学会《糖尿病医学诊疗标准》, FBG≥7 mmol/L和(或)之前确诊为T2DM,正在服用降血糖药物[5]。OP诊断标准[6]: BMD>120 mg/cm3为正常;BMD 80~120 mg/cm3为低骨量;BMD < 80 mg/cm3为OP。选取年龄和性别相匹配的同期健康体检者96名作为对照组。

    2组再按照体质量指数(bone mass index,BMI)分3个亚组: BMI < 24 kg/m2组、BMI 24~ < 28 kg/m2组、BMI≥28 kg/m2组;按年龄分4个亚组: < 40岁组、40~ < 50岁组、50~ < 60岁组、60~70岁组;按性别分为男性组和女性组。

  • 所有受试者进行全腹部CT平扫,病人取仰卧位,头先进,扫描范围从膈顶至耻骨联合。采用美国GE 64排Optima CT660扫描机及美国Mindways公司的QCT Pro 4BMD软件进行检查和分析;扫描参数: 电压120 kV,管电流349 mA,FOV 500 mm,将全腹部CT扫描数据传至Mindways公司的QCTPro 4BMD分析工作站,采用“New 3D spine exam analysis”功能进行T11~L4椎体BMD测量,计算平均BMD。

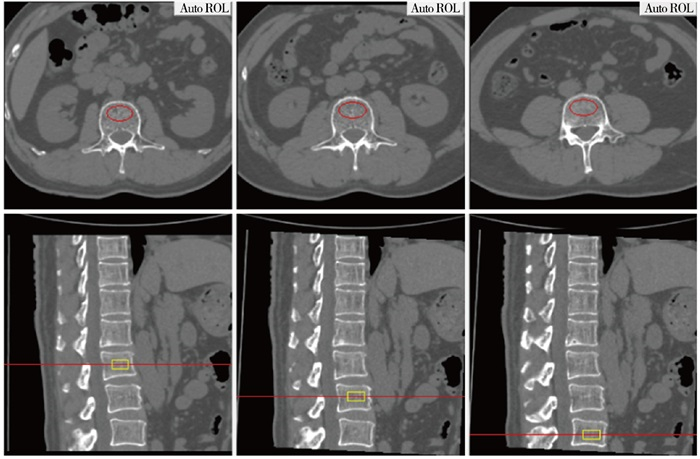
  • 图像传至QCT Pro工作站后,使用“New 3D spine exam analysis”功能软件,在横断位的定位图像上,将红色定位感兴趣区(region of interest,ROI)放在所测量椎体的中心,同时在矢状位定位图像上,黄色矩形ROI自动定位所测量的椎体上下边缘。放置ROI应注意: 放置在所测量椎体的中心;ROI层厚选择9 mm;ROI放置距皮质骨边缘2~3 mm;ROI尽可能多地包括骨松质,应避开增生骨及椎体后部的中央静脉(见图 1)。所测量的BMD值自动输出后处理软件。

  • 比较2组一般资料、不同年龄分组胸腰椎(T11~L2)OP发生率、不同BMI分组胸腰椎BMD和不同性别分组胸腰椎BMD。

  • 采用t检验、χ2检验、秩和检验和Fisher′s确切概率法。

2.   结果
  • 2组受试者性别、年龄差异均无统计学意义(P>0.05);观察组病人BMI和FPG均高于对照组(P < 0.05和P < 0.01);观察组从T11~L4椎体的BMD均低于对照组(P < 0.05~P < 0.01)(见表 1)。

    分组 n 年龄/岁 BMI/(kg/m2) FPG/(mmol/L) T11 BMD/(mg/cm3) T12 BMD/(mg/cm3) L1 BMD/(mg/cm3) L2 BMD/(mg/cm3) L3 BMD/(mg/cm3) L4 BMD/(mg/cm3)
    观察组 68 41 27 52.0±10.5 25.0±3.6 6.6±2.4 132.7±38.0 128.7±33.5 126.2±33.0 122.9±34.5 118.2±34.3 120.2±35.6
    对照组 96 45 51 49.4±11.8 23.7±3.0 4.8±0.5 149.2±35.4 144.1±36.0 141.5±36.2 138.7±38.4 133.2±36.8 133.4±37.3
    t 2.87 1.45 2.51 5.96* 2.85 2.78 2.76 2.71 2.64 2.28
    P >0.05 >0.05 < 0.05 < 0.01 < 0.01 < 0.01 < 0.01 < 0.01 < 0.01 < 0.05
    △示χ2值;*示uc
  • 随着年龄增加,2组T11~L2椎体发生OP的概率增加(P < 0.01)(见表 2)。

    分组 观察组(n=68) 对照组(n=96)
    正常骨量 骨量减少 OP 正常骨量 骨量减少 OP
    < 40岁 7(100.0) 0(0) 0(0) 20(100.0) 0(0) 0(0)
    40~ < 50岁 16(80.0) 4(20.0) 0(0) 24(92.3) 2(7.7) 0(0)
    50~ < 60岁 11(42.3) 14(53.9) 1(3.8) 20(58.8) 14(41.2) 0(0)
    60~70岁 5(33.3) 6(40.0) 4(26.7) 4(25.0) 8(50.0) 4(25.0)
    P < 0.01 < 0.01
    △示Fisher′s确切概率法
  • 当BMI < 24 kg/m2,观察组胸腰椎BMD均低于对照组(P < 0.05);当BMI 24~ < 28 kg/m2和BMI≥28 kg/m2时,2组胸腰椎BMD差异均无统计学意义(P>0.05)(见表 3)。

    分组 n T11~T12 L1~L4
    BMI < 24 kg/m2
      观察组 29 124.5±37.7 115.9±35.1
      对照组 52 155.7±35.0 145.1±37.1
        t 3.74 3.38
        P < 0.01 < 0.01
    BMI 24~ < 28 kg/m2
      观察组 26 132.4±32.7 123.5±29.4
      对照组 36 134.7±34.7 123.9±35.1
        t 0.26 0.05
        P >0.05 >0.05
    BMI≥28 kg/m2
      观察组 13 141.5±34.4 131.9±29.6
      对照组 8 141.7±25.3 138.3±27.2
        t 0.02 0.50
        P >0.05 >0.05
  • 在女性组,观察组胸腰椎BMD均低于对照组(P < 0.05~P < 0.01);在男性组,2组胸腰椎BMD差异均无统计学意义(P>0.05)(见表 4)。

    分组 n T11 BMD T12 BMD L1 BMD L2 BMD L3 BMD L4 BMD
    男性
      观察组 41 137.4±36.0 132.3±32.0 129.2±32.5 126.8±32.5 131.0(97.2, 147.8) 125.7±33.2
      对照组 45 144.1±30.0 138.9±31.9 137.0±30.1 134.8±32.6 131.1±30.9 132.0±32.6
        t 0.95 0.96 0.86* 1.13 0.75* 0.79*
        P >0.05 >0.05 >0.05 >0.05 >0.05 >0.05
    女性
      观察组 27 125.8±40.6 123.2±35.7 121.5±33.7 117.0±37.1 109.5±35.7 111.8±38.1
      对照组 51 153.7±39.3 148.6±39.1 145.6±40.2 142.2±42.9 134.9±41.6 134.6±41.3
        t 2.96 2.80 2.65 2.59 2.69 2.38
        P < 0.01 < 0.01 < 0.01 < 0.05 < 0.01 < 0.05
    *示uc
3.   讨论
  • 脊椎主要是由颈椎、胸椎、腰椎及骶尾骨等组成,胸腰椎交界处是脊椎椎体活动度最大的部位,该部位是胸椎后突与腰椎前突的交接点,也是压缩性骨折的好发部位。目前研究[7]已证实1型糖尿病会引起椎体BMD的下降,较正常人更易发生OP,即1型糖尿病会引起骨代谢的紊乱,OP的发生率增加。然而,T2DM是否会引起椎体BMD发生改变还存在争议。ABDULAMEER等[8]对T2DM病人与BMD之间的相关性47篇文献进行分析,发现有的文献表明T2DM病人的BMD是增高的,有的T2DM病人BMD是降低的,还有的报道T2DM病人与对照组之间的BMD并不存在差异。本研究发现随着年龄的增加,2组胸腰椎BMD均呈逐渐降低的趋势,且T2DM病人的BMD均低于正常人群。

    糖尿病所引起的胸腰椎压缩性骨折是OP常见的骨折类型,OP是一种骨代谢异常导致的骨骼疾病,主要以骨强度和BMD下降为特征,增加了骨折风险[9]。在国际上,OP的诊断和治疗主要依赖BMD测量和骨代谢指标的变化,临床上多是通过检测BMD的变化评估有无OP。目前双能X线吸收法(dual-energy X-rays absorptiometry,DXA)是认可度最高的BMD测量方法,但DXA测量是面积BMD,对于骨质增生、血管钙化及骨折的人群会导致测量结果不准确[6]。而QCT通过测量体积BMD将骨皮质和骨松质分开,不易受到骨质退变、血管钙化等影响,对骨量细微改变较敏感,测量结果更加精准,对早期预测OP更加精准和敏感。本研究发现,随着年龄的增加,胸腰椎交界处发生OP的概率也增加,且观察组发生OP的概率高于对照组。胸腰椎交界处是骨质疏松性骨折的好发部位可能与胸、腰椎椎体的结构和位置有关,胸椎椎体骨松质含量较腰椎椎体少,胸椎的稳定性高于腰椎等其他区域且胸椎较腰椎承重轻[10]

    目前,BMD与BMI之间的关系存在争议,LAU等[11]对亚洲男性BMD与BMI之间的研究发现,BMI与BMD呈正相关关系,BMI是BMD的保护因素。但是,也有研究[12]表明肥胖与BMD呈负相关关系,推测其原因可能是脂肪细胞和成骨细胞都来源于间质干细胞,两者存在抵抗关系,所以脂肪细胞会影响骨代谢。本研究结果发现,在BMI < 24 kg/m2组,观察组胸腰椎BMD均低于对照组;在其他BMI分组中,2组之间的胸腰椎BMD差异无统计学意义,说明BMI可能是BMD的保护因素,其机制可能是机械负荷增加刺激成骨细胞增生,从而促进椎体BMD增加,与ZHOU等[13]研究结果一致。性别也是影响骨质疏松性骨折的重要因素,本研究发现在女性组中,观察组病人胸腰椎BMD均低于对照组,与之前的研究[14]结果一致。出现这种现象的原因可能与T2DM女性的BMD降低受激素的影响,特别是雌激素,若骨骼中雌激素受体减少,会造成骨吸收和骨重建发生失调,骨量丢失加快,造成骨强度的下降,导致OP发病率的增加[15]

    综上,T2DM病人椎体BMD降低和性别有密切的联系,特别是女性T2DM病人为OP发生的高危人群,提示女性T2DM病人应加强BMD的相关检查,重视骨骼的全面评估;随着年龄的增加,胸腰椎BMD均呈下降趋势,T2DM病人发生OP的概率更高,提示T2DM病人不仅要重视糖尿病本身的治疗,也应该应重视BMD的检查,因为OP带来的骨折所造成的严重后果往往会超过糖尿病本身。同时本研究也有局限性,如纳入的样本量较少,单中心研究,可能会影响最终的研究结果。在后续研究中,会继续增大样本量进行多中心的研究。

Reference (15)

Catalog

    /

    DownLoad:  Full-Size Img  PowerPoint
    Return
    Return