• 中国科技论文统计源期刊
  • 中国科技核心期刊
  • 中国高校优秀期刊
  • 安徽省优秀科技期刊
Volume 46 Issue 1
Feb.  2021
Article Contents
Turn off MathJax

Citation:

Diagnostic value of dual-energy spectral CT material quantitative analysis in pancreatic fat deposition

  • Corresponding author: WEI Wei, weiweill@126.com
  • Received Date: 2019-12-30
    Accepted Date: 2020-03-31
  • ObjectiveTo explore the diagnostic value of dual-energy spectral CT material quantitative analysis for pancreatic fat deposition.MethodsA total of 35 patients with metabolic syndrome, such as obesity, hyperglycemia and fatty liver, were selected as the observation group.The CT values of the head, body and tail of pancreas were measured on the single energy image of optimal keV value.The fat contents of the head, body and tail of pancreas were determined on the fat-water material image.The spectral curves of pancreatic tissues were obtained to make the average spectral curves.The results were compared with the fat contents measured in 30 patients who underwent abdominal CT scan for physical examination or other diseases in the control group.ResultsAmong 35 cases in the observation group, 8 cases were found with normal body mass index, and the rest were overweight or obesity.The average CT value of pancreas decreased with the increase of body mass index (P < 0.01), while the average fat content increased with the increase of body mass index(P < 0.01).The energy CT value and water content of pancreatic tissues in observation group were significantly lower than those in control group, and the fat content was significantly higher than that in control group(P < 0.01).ConclusionsDual-energy spectral CT quantitative analysis can objectively and quantitatively describe the fat deposition in pancreas, and provide more valuable informations for early diagnosis and treatment in clinic.
  • 加载中
  • [1] 张钦和, 刘爱连. 胰腺脂肪定量的CT和MRI研究进展[J]. 国际医学放射学杂志, 2018, 41(2): 185.
    [2] ALEMPIJEVIC T, DRGASEVIC S, ZEC S, et al. Non-alcoholic fatty pancreas disease[J]. Post Med J, 2017, 93(1098): 226. doi: 10.1136/postgradmedj-2016-134546
    [3] IZQUIERDO-LAHUERTA A, MARTÍNEZ-GARCÍA C, MEDINA-GÓMEZ G. Lipotoxicity as a trigger factor of renal disease[J]. J Nephrol, 2016, 29(5): 603. doi: 10.1007/s40620-016-0278-5
    [4] OZTURK K, DOGAN T, CELIKKANAT S, et al. The association of fatty pancreas with subclinical atherosclerosis in nonalcoholic fatty liver disease[J]. Eur J Gastroenterol Hepatol, 2018, 30(4): 411. doi: 10.1097/MEG.0000000000001059
    [5] UYGUN A, KADAYIFCI A, DEMIRCI H, et al. The effect of fatty pancreas on serum glucose parameters in patients with nonalcoholic steatohepatitis[J]. Eur J Intern Med, 2015, 26(1): 37. doi: 10.1016/j.ejim.2014.11.007
    [6] 牛春燕, 吴方雄. 脂肪胰的研究现状[J]. 世界华人消化杂志, 2018, 26(21): 1280.
    [7] 李建婷, 李明龙, 宋丽媛. 胰腺脂肪浸润与代谢综合征[J]. 国际内分泌代谢杂志, 2013, 33(3): 203. doi: 10.3760/cma.j.issn.1673-4157.2013.03.017
    [8] 曾祥鹏, 胡良皡, 李兆申. 脂肪胰的研究进展[J]. 中华胰腺病杂志, 2016, 16(1): 68. doi: 10.3760/cma.j.issn.1674-1935.2016.01.022
    [9] DELLA CORTE C, MOSCA A, MAJO F, et al. Nonalcoholic fatty pancreas disease and nonalcoholic fatty liver disease: more than ectopic fat[J]. Clin Endocrinol (Oxf), 2015, 83(5): 656. doi: 10.1111/cen.12862
    [10] 曹丽坤, 楚蕾, 黄子星. 磁共振脂肪定量技术在腹盆腔部应用及进展[J]. 中国普外基础与临床杂志, 2017, 24(10): 1269.
    [11] WILMAN HR, KELLY M, GARRATT S, et al. Characterisation of liver fat in the UK Biobank cohort[J]. PLoS One, 2017, 66(1): S242.
    [12] LAPADAT AM, JIANU IR, UNGUREANU BS, et al. Non-invasive imaging techniques in assessingnon-alcoholic fatty liver disease: a current statusof available methods[J]. J Med Life, 2017, 10(1): 19. doi: 10.25122/jml-2017-0019
    [13] TOEPKER M, MORITZ T, KRAUSS B, et al. Virtual non-contrast in second-generation, dual-energy computed tomography: reliability of attenuation values[J]. Eur J Radiology, 2012, 81(3): e398. doi: 10.1016/j.ejrad.2011.12.011
    [14] 盖立平, 刘爱连, 孙美玉. 能谱CT成像多个测量参数分析[J]. 中国医学影像物理学杂志, 2015, 32(3): 317.
    [15] MATSUMOTO K, JINZAKI M, TANAMI Y, et al. Virtual monochromatic spectral imaging with fast kilovoltage switching: improved image quality as compared with that obtained with conventional 120-kVp CT[J]. Radiology, 2011, 259(1): 257. doi: 10.1148/radiol.11100978
  • 加载中
通讯作者: 陈斌, bchen63@163.com
  • 1. 

    沈阳化工大学材料科学与工程学院 沈阳 110142

  1. 本站搜索
  2. 百度学术搜索
  3. 万方数据库搜索
  4. CNKI搜索

Figures(3) / Tables(2)

Article views(4280) PDF downloads(17) Cited by()

Related
Proportional views

Diagnostic value of dual-energy spectral CT material quantitative analysis in pancreatic fat deposition

    Corresponding author: WEI Wei, weiweill@126.com
  • Department of Radiology, Provincial Hospital Affiliated to Anhui Medical University, Hefei Anhui 230001, China

Abstract: ObjectiveTo explore the diagnostic value of dual-energy spectral CT material quantitative analysis for pancreatic fat deposition.MethodsA total of 35 patients with metabolic syndrome, such as obesity, hyperglycemia and fatty liver, were selected as the observation group.The CT values of the head, body and tail of pancreas were measured on the single energy image of optimal keV value.The fat contents of the head, body and tail of pancreas were determined on the fat-water material image.The spectral curves of pancreatic tissues were obtained to make the average spectral curves.The results were compared with the fat contents measured in 30 patients who underwent abdominal CT scan for physical examination or other diseases in the control group.ResultsAmong 35 cases in the observation group, 8 cases were found with normal body mass index, and the rest were overweight or obesity.The average CT value of pancreas decreased with the increase of body mass index (P < 0.01), while the average fat content increased with the increase of body mass index(P < 0.01).The energy CT value and water content of pancreatic tissues in observation group were significantly lower than those in control group, and the fat content was significantly higher than that in control group(P < 0.01).ConclusionsDual-energy spectral CT quantitative analysis can objectively and quantitatively describe the fat deposition in pancreas, and provide more valuable informations for early diagnosis and treatment in clinic.

  • 胰腺脂肪沉积(pancreatic fat deposition,PFD)是指胰腺腺泡或胰岛细胞中有三酰甘油累积,或胰腺实质被脂肪组织替代[1]。PFD的发生可直接损害胰岛β细胞或间接抑制细胞胰岛素信号转导,最终诱发β细胞凋亡引起糖尿病,而糖尿病、肥胖、代谢综合征等又可导致胰腺发生脂肪化,进一步加重病人病情[2-6]。脂肪积聚于胰腺实质胰岛细胞或腺泡细胞是可逆的,称为胰腺脂肪浸润;脂肪细胞积聚于胰腺实质内是不可逆的,称为胰腺脂肪替代[7-8]。由于胰腺脂肪沉积部分为可逆性的,因此定量评价胰腺脂肪含量对于胰腺脂肪沉积的早期诊断、早期干预十分重要,而双能量能谱CT定量分析技术能够克服传统CT的伪影及部分容积效应等弊端、对病灶脂肪含量精准判断,对胰腺脂肪沉积预防、早期诊断具有重要价值。本研探讨双能量能谱CT定量分析技术在PFD中的诊断价值。现作报道。

1.   资料与方法
  • 收集2017年3月至2019年8月65例在我院行腹部CT扫描的病人资料,根据病人病情分为2组。观察组35例,其中男22例,女13例;年龄21~76岁;临床表现为2型糖尿病32例,代谢综合征及肥胖症1例,高胰岛素血症1例,单纯性肥胖1例;纳入标准:糖尿病、高血脂或代谢综合征病人。对照组30例,其中男20例,女10例;年龄26~65岁;纳入标准:排除糖尿病,无血脂异常,无胰腺疾病、无病理性肥胖[体质量指数(BMI) < 24 kg/m2],因体检或其他疾病行腹部CT扫描病人。BMI=体质量(kg)/身高2(m2)。BMI < 24 kg/m2正常,≥24 kg/m2超重,≥28 kg/m2肥胖。

  • 病人空腹8 h,并于检查前15~30 min饮用500~1 000 mL清水,使胃和十二指肠充盈。用GEDiscovery CT 750HD扫描机行腹部平扫,病人取仰卧位,扫描范围自膈顶至肋弓下缘,采用GSI模式扫描。扫描参数:螺旋扫描速度每圈0.8 s,螺距:1.375∶1,准直宽度0.625 mm×64;电压为高低能量(140 kVp和80 kVp)0.5 ms瞬时切换,管电流约为550 mA。

  • 将平扫单能量图像传输至Advanced Workstation(ADW 4.6,GE Health)工作站处理,行脂肪测量及分析。主要测量及分析方法为:在最佳keV值单能量图像上,分别测定胰腺头、体、尾部的CT值,并取均值;在脂肪-水物质图像上,分别测定胰腺头、体、尾部的脂肪含量,并取均值;获得胰腺各部组织的能谱曲线,并做出平均能谱曲线,以直观显示胰腺组织的脂肪含量变化情况。

  • 采用t检验、方差分析和q检验。

2.   结果
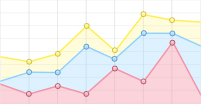
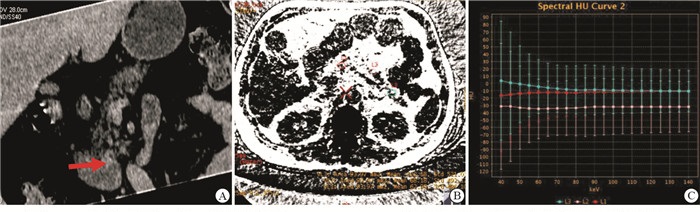
  • 所有平扫单能量图像传输至GE ADW 4.6工作站处理,进行后处理脂肪测量及分析,随着胰腺实质中脂肪含量的增强,胰腺组织能谱曲线的斜率逐渐降低。典型病例见图 1~3

  • 观察组35例中,BMI为19.03~42.44 kg/m2,8例BMI正常,其余均为超重或肥胖;胰腺平均CT值随着BMI增高呈下降趋势,而平均脂含量值随BMI增高呈上升趋势,差异均有统计学意义(P < 0.01)(见表 1)。观察组胰腺组织的能量CT值及水含量值均显著低于对照组,脂肪含量值显著高于对照组(P < 0.01)(见表 2)。

    分组 n CT值/Hu 脂肪含量(脂-水配对)/(mg/mL)
    BMI/(kg/m2)
       < 24 8 40.33±4.41 -106.21±43.29
      24~ < 28 19 35.35±6.07 -80.45±62.01
      ≥28 8 22.71±6.81**## 37.42±53.69**##
      F 19.49 15.76
      P < 0.01 < 0.01
      MS组内 35.124 3 203.463
    q检验与BMI < 24 kg/m2比较**P < 0.01,与BMI 24~28 kg/m2比较##P < 0.01
    分组 n CT值/Hu 脂肪含量(脂-水配对)/(mg/mL) 水含量(水-脂配对)/(mg/mL)
    观察组 35 31.91±6.72 -22.37±64.56 1 182.69±52.17
    对照组 30 50.23±4.13 -179.23±8.95 1 305.10±20.65
    t 13.44 14.22 12.76
    P < 0.01 < 0.01 < 0.01
3.   讨论
  • 组织学诊断为公认的PFD诊断金标准,但因活体难以取得目的组织导致临床应用受限。目前临床上用于诊断PFD的手段多为影像学检查,包括腹部超声、CT和MRI[6]。超声检查表现为胰腺回声增强,强于肝脏回声[6, 9],但是超声仅能对PFD进行定性或半定量分析,且胰腺为腹膜后脏器,易受肠道气体干扰。多数学者对MR技术在量化胰腺脂肪含量的应用进行研究,常用的方法[10-12]有MR双回波化学移位成像、频率选择脂肪预饱和技术、磁共振波谱分析等,但效果均不佳。常规CT平扫是检测PFD最普遍的方法,但传统CT采用混合能量X射线,会使CT值产生漂移,且CT值容易受机器型号及性能、伪影及部分容积效应等影响,因此准确性亦有限[13]。以瞬时双keV为核心技术的双能量能谱CT成像是CT成像领域中的一项新技术。能谱CT扫描覆盖范围广,扫描所需时间短,且CT能谱成像将传统的X线混合能量图像通过特定软件和算法分解成不同keV水平的单能量图像,可以获得扫描野内各器官的多种基物质图像(如水、钙、脂肪等)以及能谱曲线,进行物质定量及能谱综合分析[13-15],其优势在于:(1)采用最佳对比噪声比技术,可获得最佳keV的单能量图像,因其具备较高的图像质量和对比噪声比,可消除射线硬化伪影,使CT值更加准确。(2)能谱CT的物质定量分析技术可以对碘、水、脂肪等物质进行两两配对,进行物质定量测定。(3)能谱曲线反映了感兴趣区内组织在40~140 keV不同条件下CT值的连续变化情况,含脂肪组织表现为弓背向上的曲线。本研究采用能谱CT对胰腺组织脂肪的沉积情况进行研究发现,胰腺平均CT值随着BMI增高呈下降趋势,而平均脂含量值随BMI增高呈上升趋势,差异均有统计学意义(P < 0.01);观察组胰腺组织的能量CT值及水含量值均显著低于对照组,脂肪含量值显著高于对照组(P < 0.01)。能谱CT的脂肪-水物质图为PFD的判断提供了一个简单易行的测量方法,为临床早期诊断、早期治疗代谢综合征提供更多有价值的信息。

    本研究尚存在以下不足:(1)未能对高血糖、高血脂等不同原因所致的胰腺脂肪化进行分类研究。(2)因样本量较少,未能对PFD程度进行分级。今后将加大样本量,进行更细致的研究。

Reference (15)

Catalog

    /

    DownLoad:  Full-Size Img  PowerPoint
    Return
    Return