

-
膝关节骨性关节炎(osteoarthritis, OA)首先以关节软骨的变性及破坏为主, 是引起关节疼痛、晨僵和功能障碍的最常见原因。研究[1]表明, 3.0T MRI对软骨损伤检测的敏感性、特异性、准确性分别为70.10%、93.13%、77.37%。3D-WATSc与关节镜对膝关节软骨病损的诊断结果之间一致性极佳[2]。MRI对膝关节OA软骨缺损的评价采用全器官磁共振评分法(whole-organ magnetic resonance imaging score, WORMS), WORMS对软骨丢失的发生具有很高的可靠性[3]。MR T2 mapping成像是通过测量T2横向弛豫时间来定量分析关节软骨内组织成分的变化, 进而对早期软骨病变做出诊断[4]。本研究对膝关节软骨形态进行WORMS评分及T2值测量, 探讨膝关节OA软骨WORMS与T2值之间的关系。
-
收集蚌埠医学院第一附属医院65例符合中华医学会骨科学分会制订的《骨关节炎诊治指南》(2018年版)膝关节OA诊断标准[5]的膝关节OA病人65例为OA组; 年龄31~71岁; 男19例, 女46例; 右膝27例, 左膝38例。另选取同年龄段健康受试者10名作为对照组(H组), 年龄45~63岁; 女7例, 男3例; 右膝4例, 左膝6例。本研究经医院伦理委员会批准, 所有受试者均签署知情同意书。
-
采用Philips Achieva 3.0T TX双梯度超导型磁共振, 8通道膝关节线圈, Philips Extended MR Workspace 2.6.3.5工作站, 分别行膝关节矢状位PDW-SPAIR、矢状位T1WI-aTSE、矢状位T2WI-TSE、冠状位PDW-SPAIR、矢状位3D-WATSc、矢状位T2 mapping扫描。矢状位3D-WATSc扫描参数:TR=20 ms, TE=5.1 ms, FOV 160 mm×160 mm, 矩阵320×319, NEX=2, 层厚1.5 mm, 层间距0 mm, 层数18, 扫描时间266 s; 矢状位T2 mapping扫描参数:TR=2 000 ms, TE=13、26、39、52、65、78 ms, FOV 160 mm×160 mm, 矩阵268×266, NEX=1, 层厚2.5 mm, 层间距0.25 mm, 层数12×6, 扫描时间612 s。
-
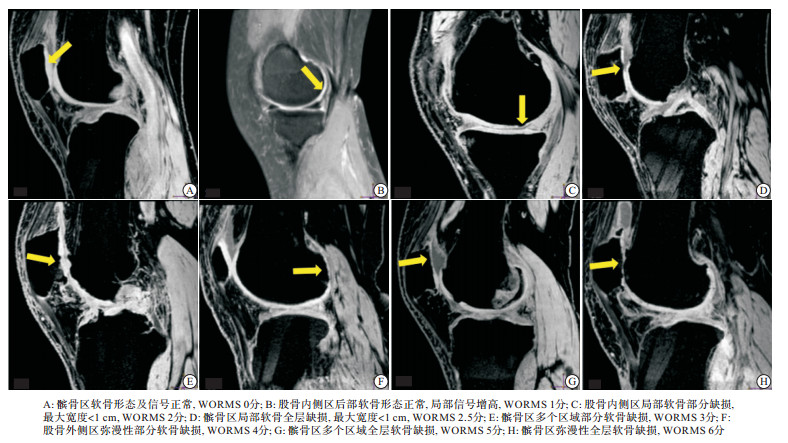
所有影像学资料均有2位经验丰富的放射科医生进行评估。在Philips Extended MR WorkSpace 2.6.3.5后处理工作站上根据WORMS将膝关节软骨划分为股骨内侧区(medial region of femoral, MF)、股骨外侧区(lateral region of femoral, LF)、胫骨内侧区(medial region of tibia, MT)、胫骨外侧区(lateral region of tibia, LT)、髌骨区(patella, P)五个亚区[6]。按WORMS半定量分析8点评分制0~6分对膝关节各亚区软骨形态进行评分(见图 1)。依据病人各亚区软骨WORMS评分, 将各亚区软骨分组:0~1分为轻度(OA1组), 21例; 2~3分为中度(OA2组), 26例; 4~6分为重度(OA3组), 18例。
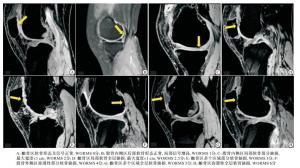
图 1 关节软骨形态WORMS半定量评分图
矢状位T2 mapping序列经后处理工作站自动生成最后一幅T2灰阶图, 在T2灰阶图上沿关节软骨边界手动划界, 依次对膝关节5个亚区软骨T2值进行测量, 每区T2值重复测量3次并取平均值, 即各亚区T2值。
-
采用Pearson简单相关分析、方差分析、q检验及LSD-t检验和ROC曲线分析。
-
OA组P、MF、MT、LT区软骨T2值与WORMS相关系数分别为0.657、0.718、0.703、0.854, 各组T2值与WORMS相关系数值有统计学意义(P < 0.05), 且呈正相关; LF区T2值与WORMS相关系数为-0.026, 且二者无相关性。
-
除股骨外侧区T2值在各组间差异无统计学意义(P>0.05)外, 其余各亚区T2值在各组间差异均有统计学意义(P < 0.01);各亚组内不同分级程度组两两比较差异均无统计学意义(P>0.05)(见表 1)。
分组 n P MF LF MT LT H组 10 32.37±1.33 41.65±1.90 43.52±1.84 31.23±1.89 30.51±2.41 OA1组 21 38.64±4.05 45.82±3.31 46.64±3.59 33.96±1.79 31.25±3.35 OA2组 26 40.10±4.67 48.96±3.03 46.61±4.89 37.60±1.30 37.71±2.34 OA3组 18 50.67±6.70 52.72±1.57 48.10±7.78 41.21±1.38 45.76±2.17 F - 36.71 41.99 1.67 116.81 120.27 P - < 0.01 < 0.01 >0.05 < 0.01 < 0.01 MS组内 - 23.272 7.366 26.972 2.406 6.953 表 1 各组平均T2值在各亚区比较
因OA1组WORMS得分0~1分的病人, 正常软骨WORMS得分亦可表现为0~1分, 所以软骨形态WORMS无法对正常软骨形态及膝关节OA早期病变软骨进行鉴别, 根据以上结果, 对P、MF、MT区H组与OA1组间T2值有统计学差异的各区, 采用ROC曲线分析T2值的诊断效能, 判断T2值在诊断膝关节OA软骨形态改变前病变的价值, 结果显示, T2值在P、MF、MT鉴别出OA1组的敏感度分别为78.3%、62.2%、54.8%, 特异度分别为100%、80%、70%(见表 2)。
亚区 临界值/ms 最大约登指数 曲线下面积 敏感度/% 特异度/% P 34.55 0.783 0.886 78.3 100 MF 45.20 0.482 0.757 68.2 80 MT 33.75 0.248 0.523 54.8 70 表 2 P、MF、MT区T2值在H组与OA1组间的诊断效能评价
-
王立振等[2]在评价3D-WATSc序列在膝关节软骨缺损病变中的价值, 与关节镜结果相对照中发现该序列诊断软骨病变的敏感性、特异性、准确性分别为96.4%、87.3%、92.4%, Kappa值为0.844, 3D-WATSc与关节镜对膝关节软骨病损的诊断结果之间一致性极佳, 可以确切反映膝关节软骨病变。本研究中采用常规2D FSE及3D-WATSc序列进行膝关节OA软骨形态评价。3D-WATSc序列亦是水激励三维脂肪抑制扰相梯度回波序列, 即将三维扰相梯度回波序列与水激励技术相结合[7]。该序列运用短TR, 小翻转角度, 关节软骨呈高信号与周围组织形成鲜明对比, 相对于3D-FS-SPGR, 该序列扫描时间短, 空间分辨率高, 消除了化学位移伪影, 不受磁场不均匀性影响, 抑制效果好。
-
T2 mapping成像技术即采用多平面多回波序列, 在静磁场内施加一个90°射频脉冲, 偶极子吸收能量后变得极不稳定, 通过向周围自旋-晶格组织释放能量维持平衡, T2值即代表偶极子在受激励后释放能量这一过程所需时间[8]。横向磁化时间主要受软骨组织结构各向异性的影响, 与胶原蛋白的含量、排列方向及水的含量有关, 通过测量T2横向弛豫时间可定量分析关节软骨内组织成分的变化[9]。T2 mapping成像现已被临床用于评估膝关节OA软骨组织成分及超微结构。各项研究[10]证实T2 mapping可提高膝关节OA病人早期软骨退行性变的检出率, 随年龄增长软骨T2值逐渐升高。T2 mapping可用于检测早期OA软骨基质的变化[11], 亦可监测软骨退变进程及治疗后软骨修复[12]。亦有研究[13]提示在负荷情况下运用T2 mapping成像随访术后病人可提供更多关于软骨修复组织成分及结构的信息。
本研究采用矢状位T2 mapping成像序列, 运用6个回波时间。研究[14]证实各亚区整体T2值测量法相对于设置多个感兴趣性T2值测量方法, 可重复性误差较小, 所以在T2灰阶图上沿关节软骨边界手动划界, 依次对膝关节5个亚区整体软骨T2值进行测量, 以提高T2值测量的可重复性, 进而定量分析软骨组织学变化。
-
JOSEPH等[15]对OA病人软骨T2值随软骨退变的纵向研究中, 采用修订后的WORMS将膝关节划分为五区, 进行软骨退变评分, 结果显示随WORMS得分的升高, 软骨T2值亦升高, 证实T2值与WORMS评分具有正相关性。运用3.0T MRI对体外人类关节软骨行T2 mapping成像与软骨组织学分级进行对照, 分级间T2值差异有统计学意义, 且两者呈正相关, 说明T2值是OA软骨较好的一个生物学标志, 更适合对膝关节OA的早期诊断[16]。
本研究中将膝关节OA病人各亚区T2值与WORMS进行相关性比较, 结果显示OA组P、MF、MT、LT区软骨T2值与WORMS呈正相关随分级程度增大各亚区T2值逐渐增高。两两比较发现T2值能够区分膝关节OA严重程度。且P、MF、MT区T2值在H组与OA1组间差异有统计学意义, 说明T2值差异最大的区域主要在膝关节承重区, T2值能够做到对膝关节OA的早期诊断, 并能发现软骨形态改变前的病变。
膝关节骨性关节炎软骨形态与T2值的MRI对比性分析
Comparative analysis of MRI findings of cartilage morphology and T2 value in knee osteoarthritis
-
摘要:
目的对比分析膝关节骨性关节炎(OA)软骨损伤的MRI形态评分及T2值变化。 方法收集65例膝关节OA病人及10名健康受试者,行膝关节MRI矢状位3D-WATSc、T2 mapping扫描,将病人组分轻度(OA1)组、中度(OA2)组、重度(OA3)组,评价OA组各亚区软骨T2值与全器官磁共振评分法(WORMS)的相关性,比较各亚区T2值在各组间的差异。 结果除股骨外侧区外,OA组软骨T2值与WORMS评分呈正相关(r=0.657~r=0.854,P < 0.05);除股骨外侧区T2值外,其余各亚区T2值在各组间差异均有统计学意义(P < 0.01);T2值在髌骨区、内侧股骨区、内侧胫骨区发现膝关节OA软骨形态改变前病变的敏感性分别为78.3%、68.2%、54.8%,特异度分别为100%、80%、70%。 结论MRI半定量评价指标WORMS与定量评价指标T2值均能有效评价膝关节OA软骨变化,T2值能够区分膝关节OA软骨损伤程度,发现软骨形态改变前的病变。 Abstract:ObjectiveTo compare the changes of MRI morphological score and T2 value of cartilage injury in knee osteoarthritis(OA). MethodsSixty-five knee OA patients and 10 healthy subjects were selected to undergo MRI scanning of sagittal 3D-WATSc and T2 mapping.The patients were divided into mild(OA1), moderate(OA2) and severe(OA3) groups.The correlation between T2 value of cartilage and the whole-organ magnetic resonance imaging score (WORMS) in each sub-region of OA groups was evaluated, and the difference of T2 value in each sub-region among three groups was compared. ResultsExcept for the lateral region of femoral, T2 values were positively correlated with WORMS scores in OA groups(r=0.657-r=0.854, P < 0.05), and the differences of T2 values in other sub-regions were statistically significant (P < 0.01).The sensitivity of T2 value in patella, medial region of femoral and medial region of tibia to detect the pre-pathological changes of cartilage morphology of knee OA was 78.3%, 68.2% and 54.8%, respectively, and the specificity was 100%, 80% and 70%, respectively. ConclusionsBoth the MRI semi-quantitative evaluation index WORMS, and the MRI quantitative evaluation index T2 value can effectively evaluate the change of knee OA cartilage.T2 value can differentiate the severity of cartilage injury of knee OA, and discover the cartilage lesions before morphological changes. -
Key words:
- osteoarthritis /
- knee /
- magnetic resonance imaging /
- T2 value /
- articular cartilage
-
表 1 各组平均T2值在各亚区比较
分组 n P MF LF MT LT H组 10 32.37±1.33 41.65±1.90 43.52±1.84 31.23±1.89 30.51±2.41 OA1组 21 38.64±4.05 45.82±3.31 46.64±3.59 33.96±1.79 31.25±3.35 OA2组 26 40.10±4.67 48.96±3.03 46.61±4.89 37.60±1.30 37.71±2.34 OA3组 18 50.67±6.70 52.72±1.57 48.10±7.78 41.21±1.38 45.76±2.17 F - 36.71 41.99 1.67 116.81 120.27 P - < 0.01 < 0.01 >0.05 < 0.01 < 0.01 MS组内 - 23.272 7.366 26.972 2.406 6.953  下载: 导出CSV
表 2 P、MF、MT区T2值在H组与OA1组间的诊断效能评价
亚区 临界值/ms 最大约登指数 曲线下面积 敏感度/% 特异度/% P 34.55 0.783 0.886 78.3 100 MF 45.20 0.482 0.757 68.2 80 MT 33.75 0.248 0.523 54.8 70
下载: 导出CSV
-
[1] 李显, 赵力, 王淑丽, 等.骨性关节炎患者膝关节软骨损伤的关节镜与MRI诊断分级研究[J].中国矫形外科杂志, 2017, 25(1):29. [2] 王立振, 陈健湘, 张豫, 等.3D-WATSc序列在膝关节软骨病损诊断中的价值[J].临床放射学杂志, 2012, 31(7):1003. [3] HEILMEIER U, WAMBA JM, JOSEPH GB, et al.Baseline knee joint effusion and medial femoral bone marrow edema, in addition to MRI-based T2 relaxation time and texture measurements of knee cartilage, can help predict incident total knee arthroplasty 4-7 years later:data from the Osteoarthritis Initiative[J].Skeletal Radiol, 2019, 48(1):89. doi: 10.1007/s00256-018-2995-4 [4] SUROWIEC RK, LUCAS EP, HO CP.Quantitative MRI in the evaluation of articular cartilage health:reproducibility and variability with a focus on T2 mapping[J].Knee Surg Sports Traumatol Arthrosc, 2014, 22(6):1385. doi: 10.1007/s00167-013-2714-6 [5] 中华医学会骨科学分会关节外科学组.骨关节炎诊疗指南:2018版[J].中华骨科杂志, 2018, 38(12):705. doi: 10.3760/cma.j.issn.0253-2352.2018.12.001 [6] ALIZAI H, VIRAYAVANICH W, JOSEPH GB, et al.Cartilage lesion score:comparison of quantitative assessment score with established semiquantitative MR coring systems[J].Radiology, 2014, 271(2):479. doi: 10.1148/radiol.13122056 [7] ÖZGEN A, FRAT Z.Quantitative Comparison of 2D and 3D MRI Techniques for the Evaluation of Chondromalacia Patellae in 3.0 T MR Imaging of the Knee[J].Acta Med Anatol, 2016, 4(3):118. doi: 10.5505/actamedica.2016.81905 [8] 李淑华, 张俊祥.膝关节软骨磁共振生理成像技术的应用与进展[J].医学研究生学报, 2015, 28(10):1116. [9] WONG CS, YAN CH, GONG NJ, et al.Imaging biomarker with T1ρ and T2 mappings in osteoarthritis-in vivo human articular cartilage study[J].Eur J Radiol, 2013, 82(4):647. doi: 10.1016/j.ejrad.2012.11.036 [10] BRUNO F, ARRIGONI F, PALUMBO P, et al.New advances in MRI diagnosis of degenerative osteoarthropathy of the peripheral joints[J].Radiol Med, 2019, 124(11):1121. doi: 10.1007/s11547-019-01003-1 [11] JURAS V, SCHREINER M, LAURENT D, et al.The comparison of the performance of 3 T and 7 T T2 mapping for untreated low-grade cartilage lesions[J].Magn Reson Imaging, 2019, 55:86. doi: 10.1016/j.mri.2018.09.021 [12] GUERMAZI A, ROEMER FW, ALIZAI H, et al.State of the art:MR Imaging after knee cartilage repair surgery[J].Radiology, 2015, 277(1):23. doi: 10.1148/radiol.2015141146 [13] SCHOENBAUER E, SZOMOLANYI P, SHIOMI T, et al.Cartilage evaluation with biochemical MR imaging using in vivo knee compression at 3T-comparison of patients after cartilage repair with healthy volunteers[J].J Biomech, 2015, 48(12):3349. doi: 10.1016/j.jbiomech.2015.06.016 [14] HANNILA I, LAMMENTAUSTA E, TERVONEN O, et al.The repeatability of T2 relaxation time measurement of human knee articular cartilage[J].Magma, 2015, 28(6):547. doi: 10.1007/s10334-015-0494-3 [15] JOSEPH GB, BAUM T, ALIZAI H, et al.Baseline mean and heterogeneity of MR cartilage T2 are associated with morphologic degeneration of cartilage, meniscus, and bone marrow over 3years-data from the Osteoarthritis Initiative[J].Osteoarthritis Cartilage, 2012, 20(7):727. doi: 10.1016/j.joca.2012.04.003 [16] KIM T, MIN BH, YOON SH, et al.Skeletal Radiol.An in vitro comparative study of T2 and T2* mappings of human articular cartilage at 3-Tesla MRI using histology as the standard of reference[J].Skeletal Radiol, 2014, 43(7):947. doi: 10.1007/s00256-014-1872-z -

 点击查看大图
图(1)表(2)
计量
- 文章访问数: 4609
- HTML全文浏览量: 2566
- PDF下载量: 18
- 被引次数: 0
