

-
骨质疏松症(osteoporosis,OP)和心血管疾病在中老年病人中发病率较高,流行病学和临床研究发现骨骼肌肉疾病如OP与心血管疾病之间存在一定的关系[1],并进一步得到二者的共同风险因素,如久坐不动、吸烟和女性雌激素不足[2-4]。此外,这两种疾病在各自的病因中有共同的炎症机制[5-7]。脂质在动脉粥样硬化的发展中起着关键作用,动脉粥样硬化是心血管疾病的炎症基础。但关于骨密度(BMD)与血脂的关系仍存在争议。考虑到OP更好发于绝经后女性,心血管疾病发生率增加,而血脂在二者之前似乎起着某种联系,故本研究以绝经后女性为对象,探讨血脂与BMD水平的关系,同时观察体质量指数(BMI)和绝经年限与BMD是否存在关联,从而为早期筛查和防治绝经后OP和心血管疾病提供参考依据。
-
选取2020年6月至2021年5月我院就诊的绝经后女性141例病人为研究对象,告知研究对象该研究的流程及需要配合的事项。本研究已在我院伦理委员会备案。纳入标准:年龄45~85岁;自然绝经时间大于1年。排除标准:患有结缔组织病等慢性疾病者;严重心脑血管疾病、肝肾疾病及呼吸系统疾病者;使用类固醇药物(泼尼松龙、地塞米松和倍他米松);曾经行过卵巢全切术者;恶性肿瘤病人。
-
通过临床问诊方式获得所有研究对象的年龄、身高、体质量、绝经年龄,并计算BMI和绝经年限。
-
采用美国Hologic公司生产的双能X线BMD检测仪(DXA)测定所有研究对象的BMD,并由我科骨密度检测室1名经过专业培训的技师操作。主要测定腰椎BMD(LBMD)、股骨颈BMD(FBMD)、全髋关节BMD(TBMD)水平。根据2017年《原发性骨质疏松症诊疗指南》中OP的诊断标准[8],结合双能X线结果(T值为标准)将研究对象分为3组,即A组(骨质疏松者,T≤-2.5)、B组(骨量减少者,-2.5 < T < -1.0)和C组(骨量正常者,T≥-1.0)。
-
所有研究对象均采集晨起空腹静脉血标本,使用全自动生化仪测定各目标血脂的水平[主要总胆固醇(TC)、低密度脂蛋白(LDL)、三酰甘油(TG) 和高密度脂蛋白(HDL)]。
-
采用t检验、方差分析、Pearson相关分析和logistic回归分析。
-
3组一般临床特征差异无统计学意义(P < 0.05)(见表 1)。
分组 n 年龄/岁 身高/cm 体质量/kg BMI/(kg/m2) A组 67 64.7±8.23 156.27±5.72 57.45±9.36 23.53±3.87 B组 43 64.3±9.10 157.07±5.68 61.13±8.62 25.44±3.57 C组 31 60.6±9.17 158.49±6.11 69.35±11.31 27.56±3.82 F — 2.52 1.56 0.45 0.33 P — >0.05 >0.05 >0.05 >0.05 MS组内 — 75.363 33.582 92.322 14.212 表 1 3组一般特征比较(x±s)
-
3组LBMD、FBMD、TBMD比较,C组>B组>A组(P < 0.05);3组绝经年限差异无统计学意义(P < 0.05)(见表 2)。
分组 n 绝经年限/年 LBMD/(g/cm2) FBMD/(g/cm2) TBMD/(g/cm2) A组 67 16.02±9.13 0.70±0.07 0.57±0.09 0.71±0.11 B组 43 15.31±10.32 0.87±0.08** 0.65±0.08** 0.80±0.08 C组 31 11.34±9.01 1.02±0.08**## 0.80±0.11**## 0.97±0.10* F — 2.72 185.04 61.58 3.13 P — >0.05 < 0.01 < 0.01 < 0.05 MS组内 — 89.501 0.006 0.008 0.224 q检验:与A组比较*P < 0.05, **P < 0.01;与B组比较##P < 0.01 表 2 3组病人BMD及绝经年限比较(x±s)
-
3组HDL、TG、TC水平比较,差异均有统计学意义(P < 0.05~P < 0.01),其中A组HDL水平高于C组(P < 0.05);A组和B组TG水平均低于C组(P < 0.01);C组TC水平低于A组(P < 0.05)。3组LDL水平差异无统计学意义(P < 0.05)(见表 3)。
分组 n HDL/(mmol/L) LDL/(mmol/L) TG/(mmol/L) TC/(mmol/L) A组 67 1.29±0.33 2.74±0.86 1.47±0.74 5.03±1.11 B组 43 1.17±0.38 2.49±0.64 1.49±0.81 4.62±0.98 C组 31 1.07±0.46* 2.54±1.07 2.11±0.89**## 4.35±1.06* F — 4.27 1.36 7.58 4.88 P — < 0.05 >0.05 < 0.01 < 0.01 MS组内 — 0.144 0.727 0.636 1.128 q检验:与A组比较*P < 0.05, **P < 0.01;与B组比较##P < 0.01 表 3 3组病人血脂水平比较(x±s)
-
相关性分析显示,年龄和绝经年限与各部位BMD值呈负相关关系(P < 0.05~P < 0.01);身高、体质量及BMI与各部位的BMD呈正相关关系(P < 0.05~P < 0.01)(见表 4)。
一般特征 LBMD FBMD TBMD 年龄 -0.162* -0.477** -0.395** 身高 0.139* 0.347** 0.280** 体质量 0.455** 0.445** 0.504** BMI 0.419** 0.306** 0.402** 绝经年限 -0.187* -0.483** -0.417** *P < 0.05, **P < 0.01 表 4 一般特征与不同部位BMD的相关性分析(r)
-
TG水平与LBMD、FBMD、TBMD呈正相关关系(P < 0.01);TC水平与LBMD呈负相关关系(P < 0.05~P < 0.01)(见表 5)。
血脂 LBMD FBMD TBMD HDL -0.162 -0.121 -0.143 LDL -0.003 0.133 0.125 TG 0.266** 0.277** 0.270** TC -0.176* 0.003 -0.022 *P < 0.05, **P < 0.01 表 5 血脂与不同部位BMD的相关性分析(r)
-
将B组+C组合并为D组(非骨质疏松组),以A组和D组作为二分类变量进行logistic回归分析,以D组为对照,纳入自变量因素包括:BMI、年龄、绝经年限、HDL、TG和TC。结果显示:高BMI、高TG者OP发生风险较低,高龄、绝经年限长及高TC者OP发生风险较高(见表 6)。
因素 B SE Waldχ2 P OR (95%CI) BMI -0.181 0.055 10.93 < 0.01 0.834(0.749~0.929) 年龄 0.096 0.038 6.54 < 0.05 1.101(1.023~1.185) 绝经年限 0.054 0.022 6.09 < 0.05 1.056(1.011~1.102) HDL 0.153 0.605 0.06 >0.05 1.165(0.356~3.812) TG -0.096 0.264 0.13 < 0.05 0.908(0.542~0.924) TC 0.553 0.225 6.05 < 0.05 1.738(1.119~2.701) 表 6 绝经后女性OP发生的多因素logistic分析
-
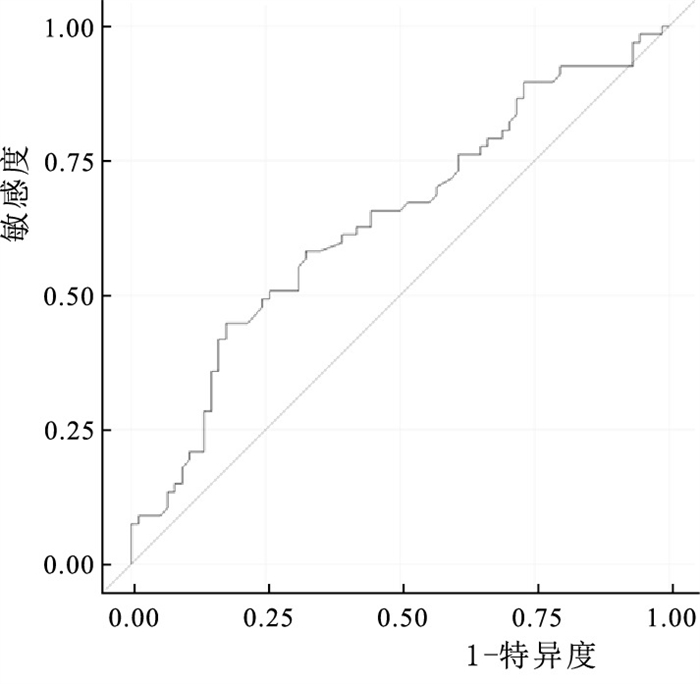
由上述研究结果得出血脂中TC是发生OP的危险因素,绘制ROC曲线分析TC预测绝经后女性发生OP的价值, AUC为0.636(P < 0.05)(见图 1)。

图 1 预测OP发生的ROC曲线
-
OP是老年人常见的慢性骨代谢疾病,其特征主要表现为低骨量和骨折风险高,绝经后女性OP表现尤为突出,其骨折后发病率和死亡率增加[9]。然而,脂质对骨稳态的影响近年来一直是争论的焦点。从细胞培养到动物研究,构成脂质分布的各种成分对骨代谢的影响已在实验模型中得到广泛研究,研究集中在脂质对骨中主要细胞成分如成骨细胞和破骨细胞的影响,以及对骨髓生态位的影响[10-11]。心血管疾病亦多发于老年病人,这两种疾病之间存在潜在的共同机制。一项荟萃分析[12]显示低BMD和骨折是心血管疾病发生的危险因素。LOPES[13]研究发现,绝经后女性合并有BMD降低者其动脉粥样硬化发生风险增加。OP与心血管疾病严重危害着绝经后妇女的身心健康。
本研究发现绝经后女性LBMD与TC呈负相关关系,且经回归分析显示,绝经后女性合并高胆固醇血症发生OP风险较高。据报道TC及其代谢物可能会影响骨髓祖细胞的增殖和分化,高胆固醇血症通过减少成骨细胞数量来改变骨髓微环境的结构,抑制成骨细胞功能,促进破骨细胞的生成[14]。绝经后女性雌激素水平越低,其血清TC水平越高,且绝经后女性雌激素水平下降可引起钙质流失和BMD降低,表明TC与BMD其实存在一定相关性[15]。本研究也证实了这一点。ERSOY等[16]研究发现,绝经后骨质疏松症妇女的TC水平低于BMD正常者。ZOLFAROLI等[17]研究显示TC与BMD之间没有相关性。可见二者间关系有一定争议。
对于TG与BMD的关系,部分文献显示二者是正相关关系,这也与本研究结果较一致,我们发现OP病人TG水平更低,且TG水平越低,其BMD值越低。伊朗的一项研究发现女性的TG水平越高,其脊柱BMD和FBMD值越高, HDL-C水平较高的老年妇女FBMD和LBMD较低[18]。另一项研究9显示,血清TG水平降低可能提示有发生OP的风险,高水平的TG对于绝经后女性发生OP有一定保护作用。对于LDL与BMD的关系,我们尚未发现它与BMD的相关性,但有文献显示LDL与BMD是呈负相关关系[20],这可能需要更大样本量或者多中心研究来进一步证实二者间的关系。本研究中单因素分析结果显示, 骨质疏松组的血清HDL水平更高,然而Pearson相关分析显示HDL与BMD之间无相关性,同时多因素线性回归分析只发现TC是绝经后女性发生OP的危险因素。一项横断面研究[21]结果显示,OP参与者年龄越大,血清HDL水平越高,其BMD越低。另一项关于血脂与骨质疏松的荟萃分析[22]显示血清HDL水平在骨质疏松组明显升高,合并高HDL者其发生OP的风险相对较高[22]。本研究结果也证实了这一点。
本研究还发现绝经后女性,其绝经年限长、高龄者其发生OP发生的风险较高,而BMI是其发生OP的保护性因素。绝经年限越长其体内雌激素水平越低,而雌激素缺乏可能是骨脂代谢失衡的重要因素。绝经后由于雌激素水平下降,造成脂骨代谢失衡,这也是绝经后OP发生的一个重要机制[23]。通过多因素分析发现血脂中TC是绝经后女性发生OP的危险因素,随后通过绘制ROC曲线,计算AUC评估TC用来预测绝经后女性发生OP的风险,发现单纯通过TC水平来预测OP发生的风险其价值不大,最为准确的方法依然是行双能X线检测,然而绝经后女性体检时发现TC升高,应该警惕OP的发生。
综上所述,绝经后女性血脂与BMD间存在一定联系,体现在不同血脂指标与不同部位的BMD存在不同的关系。本研究发现绝经后女性HDL、TG和TC与BMD有关,TG与LBMD、FBMD、TBMD正相关,是发生OP的保护性因素,提示绝经后女性不是将TG控制的越低越好,维持在合适水平有助于维持骨量,预防OP的发生。而TC与LBMD呈负相关关系,是OP发生的危险因素,所以为了防治OP和心血管疾病,需将TC降至正常较低水平。至于将TG和TC控制在何种范围,可能需要再进一步将血脂水平分层分组研究,同时为了进一步明确血脂与BMD的关系及导致这种关系的确切机制,需要进一步扩大样本量或多中心大样本的研究。
绝经后女性血脂水平与骨密度的相关性研究
orrelation between blood lipid level and bone mineral density in postmenopausal women
-
摘要:
目的研究绝经后女性骨密度与血脂水平、体质量指数(BMI)及绝经年限的相关性。 方法选择141例绝经后女性作为研究对象,均在骨密度实验室检测骨密度(BMD)水平(主要检测部位为腰椎L1~4、股骨颈和髋关节,部分病人加做前臂),并根据检测结果(T值为标准)将研究对象分为3组,A组(骨质疏松者,T≤-2.5)、B组(骨量减少者,-2.5 < T < -1.0)和C组(正常骨量病人,T≥-1.0)。同时采集所有研究对象的空腹血,检测其总胆固醇(TC)、低密度脂蛋白(LDL)、三酰甘油(TG) 和高密度脂蛋白(HDL)水平。详细记录病人的身高、体质量、年龄、绝经年龄,计算BMI和绝经年限。 结果3组腰椎BMD(LBMD)、股骨颈BMD、全髋关节BMD比较,C组>B组>A组(P < 0.05)。3组HDL、TG、TC水平比较,差异均有统计学意义(P < 0.05~P < 0.01),其中A组HDL水平高于C组(P < 0.05);A组和B组TG水平均低于C组(P < 0.01);C组TC水平低于A组(P < 0.05)。3组LDL水平差异无统计学意义(P < 0.05)。相关性分析显示,年龄和绝经年限与各部位BMD值呈负相关关系(P < 0.05~P < 0.01);身高、体质量及BMI与各部位的BMD呈正相关关系(P < 0.05~P < 0.01)。TG水平与LBMD、股骨颈BMD、全髋关节BMD呈正相关关系(P < 0.01);TC水平与LBMD呈负相关关系(P < 0.05~P < 0.01)。多因素logistic回归分析结果显示,高BMI、高TG者骨质疏松症(OP)发生风险较低,高龄、绝经年限长及高TC者OP发生风险较高。绘制ROC曲线分析TC预测绝经后女性发生OP的价值,计算出AUC为0.636(P < 0.05)。 结论绝经后女性不同血脂与不同部位BMD的相关性不同,TC升高与LBMD下降有关,低BMI、高龄、绝经年限长及高TC的绝经后女性更易发生骨质疏松。 Abstract:ObjectiveTo study the correlation between bone mineral density (BMD) level and blood lipid level, body mass index (BMI), menopausal years in postmenopausal women. MethodsA total of 141 postmenopausal women were selected as the research objects.All research objects were tested for BMD (including lumbar L1-4, femoral neck and hip joint, some patients added forearm) in the BMD testing room.According to the results (T value as the standard), the research objects were divided into three groups: group A(osteoporosis, T ≤-2.5), group B(osteopenia, -2.5 < T < -1.0) and group C(normal bone mass, T ≥-1.0).Fasting blood from all subjects were collected to detect the levels of total cholesterol (TC), low density lipoprotein (LDL), triglycerides (TG) and high density lipoprotein (HDL).The height, weight, age, and menopause age of patients were recorded.The BMI and menopause years were calculated. ResultsThe comparison results of LBMD, FBMD and TBMD in the three groups were group C>group B>group A (P < 0.05).There were significant differences in HDL, TG and TC levels among the three groups (P < 0.05 to P < 0.01), and the HDL level in group A was higher than that in group C (P < 0.05);TG levels in group A and group B were lower than those in group C (P < 0.01);TC level in group C was lower than that in group A(P < 0.05).There was no significant difference in LDL levels among the three groups(P>0.05).Correlation analysis showed that age and menopausal years were negatively correlated with BMD values in all parts (P < 0.05 to P < 0.01).Height, body weight and BMI were positively correlated with BMD in all parts (P < 0.05 to P < 0.01).TG level was positively correlated with LBMD, FBMD and TBMD (P < 0.01).TC level was negatively correlated with LBMD (P < 0.05 to P < 0.01).Multivariate logistic regression analysis showed that the risk of OP was lower in those with high BMI and TG, and higher in those with old age, long menopause and high TC.The ROC curve was drawn to analyze the value of TC in predicting OP in postmenopausal women, and the area under ROC curve was calculated to be 0.636 (P < 0.05). ConclusionsThe correlation between different blood lipids and BMD in different parts of postmenopausal women is different.The increase of TC is related to the decrease of LBMD.Postmenopausal women with low BMI, old age, long menopause years and high TC are more prone to osteoporosis. -
Key words:
- blood lipid /
- menopause /
- bone mineral density /
- osteoporosis
-
表 1 3组一般特征比较(x±s)
分组 n 年龄/岁 身高/cm 体质量/kg BMI/(kg/m2) A组 67 64.7±8.23 156.27±5.72 57.45±9.36 23.53±3.87 B组 43 64.3±9.10 157.07±5.68 61.13±8.62 25.44±3.57 C组 31 60.6±9.17 158.49±6.11 69.35±11.31 27.56±3.82 F — 2.52 1.56 0.45 0.33 P — >0.05 >0.05 >0.05 >0.05 MS组内 — 75.363 33.582 92.322 14.212  下载: 导出CSV
表 2 3组病人BMD及绝经年限比较(x±s)
分组 n 绝经年限/年 LBMD/(g/cm2) FBMD/(g/cm2) TBMD/(g/cm2) A组 67 16.02±9.13 0.70±0.07 0.57±0.09 0.71±0.11 B组 43 15.31±10.32 0.87±0.08** 0.65±0.08** 0.80±0.08 C组 31 11.34±9.01 1.02±0.08**## 0.80±0.11**## 0.97±0.10* F — 2.72 185.04 61.58 3.13 P — >0.05 < 0.01 < 0.01 < 0.05 MS组内 — 89.501 0.006 0.008 0.224 q检验:与A组比较*P < 0.05, **P < 0.01;与B组比较##P < 0.01
下载: 导出CSV
表 3 3组病人血脂水平比较(x±s)
分组 n HDL/(mmol/L) LDL/(mmol/L) TG/(mmol/L) TC/(mmol/L) A组 67 1.29±0.33 2.74±0.86 1.47±0.74 5.03±1.11 B组 43 1.17±0.38 2.49±0.64 1.49±0.81 4.62±0.98 C组 31 1.07±0.46* 2.54±1.07 2.11±0.89**## 4.35±1.06* F — 4.27 1.36 7.58 4.88 P — < 0.05 >0.05 < 0.01 < 0.01 MS组内 — 0.144 0.727 0.636 1.128 q检验:与A组比较*P < 0.05, **P < 0.01;与B组比较##P < 0.01
下载: 导出CSV
表 4 一般特征与不同部位BMD的相关性分析(r)
一般特征 LBMD FBMD TBMD 年龄 -0.162* -0.477** -0.395** 身高 0.139* 0.347** 0.280** 体质量 0.455** 0.445** 0.504** BMI 0.419** 0.306** 0.402** 绝经年限 -0.187* -0.483** -0.417** *P < 0.05, **P < 0.01
下载: 导出CSV
表 5 血脂与不同部位BMD的相关性分析(r)
血脂 LBMD FBMD TBMD HDL -0.162 -0.121 -0.143 LDL -0.003 0.133 0.125 TG 0.266** 0.277** 0.270** TC -0.176* 0.003 -0.022 *P < 0.05, **P < 0.01
下载: 导出CSV
表 6 绝经后女性OP发生的多因素logistic分析
因素 B SE Waldχ2 P OR (95%CI) BMI -0.181 0.055 10.93 < 0.01 0.834(0.749~0.929) 年龄 0.096 0.038 6.54 < 0.05 1.101(1.023~1.185) 绝经年限 0.054 0.022 6.09 < 0.05 1.056(1.011~1.102) HDL 0.153 0.605 0.06 >0.05 1.165(0.356~3.812) TG -0.096 0.264 0.13 < 0.05 0.908(0.542~0.924) TC 0.553 0.225 6.05 < 0.05 1.738(1.119~2.701)
下载: 导出CSV
-
[1] LELLO S, CAPOZZI A, SCAMBIA G. Osteoporosis and cardiovascular disease: an update[J]. Gynecol Endocrinol, 2015, 31(8): 590. doi: 10.3109/09513590.2015.1041908 [2] FRANCULA-ZANINOVIC S, NOLA IA. Management of measurable variable cardiovascular disease' risk factors[J]. Curr Cardiol Rev, 2018, 14(3): 153. doi: 10.2174/1573403X14666180222102312 [3] YOUNG L, CHOUNIQUE L. Cardiovascular risk factors in women[J]. Heart, 2019, 105(21): 1656. doi: 10.1136/heartjnl-2018-314268 [4] HONIGBERG MC, ZEKAVAT SM, ARAGAM K, et al. Association of premature natural and surgical menopause with incident cardiovascular disease[J]. JAMA, 2019, 322(24): 2411. doi: 10.1001/jama.2019.19191 [5] WOLF D, LEY K. Immunity and inflammation in atherosclerosis[J]. Circ Res, 2019, 124(2): 315. doi: 10.1161/CIRCRESAHA.118.313591 [6] PONZETTI M, RUCCI N. Updates on osteoimmunology: What's new on the cross-talk between bone and immune system[J]. Front Endocrinol (Lausanne), 2019, 10: 236. doi: 10.3389/fendo.2019.00236 [7] UDAGAWA N, KOIDE M, NAKAMURA M, et al. Osteoclast differentiation by RANKL and OPG signaling pathways[J]. J Bone Miner Metab, 2021, 39(1): 19. doi: 10.1007/s00774-020-01162-6 [8] 夏维波, 章振林, 林华, 等. 原发性骨质疏松症诊疗指南(2017)[J]. 中国骨质疏松杂志, 2019, 25(3): 281. doi: 10.3969/j.issn.1006-7108.2019.03.001 [9] CAMACHO PM, PETAK SM, BINKLEY N, et al. American association of clinical endocrinologists and American college of endocrinology clinical practice guidelines for the diagnosis and treatment of post-menopausal osteoporosis-2016[J]. Endocr Pract, 2016, 22(4): 1. [10] YIN W, LI Z, ZHANG W. Modulation of bone and marrow niche by cholesterol[J]. Nutrients, 2019, 11(6): 1394. doi: 10.3390/nu11061394 [11] PAPACHRISTOU NI, BLAIR HC, KYPREOS KE, et al. High-density lipoprotein (HDL) metabolism and bone mass[J]. J Endocrinol, 2017, 233(2): R95. [12] VERONESE N, STUBBS B, CREPALDI G, et al. Relationship between low bone mineral density and fractures with incident cardiovascular disease: a systematic review and meta-analysis[J]. J Bone Miner Res, 2017, 32(5): 1126. doi: 10.1002/jbmr.3089 [13] LOPES NHM. The interface between osteoporosis and atherosclerosis in postmenopausal women[J]. Arq Bras Cardiol, 2018, 110(3): 217. [14] MA X, FENG Y. Hypercholesterolemia tunes hematopoietic stem/progenitor cells for inflammation and atherosclerosis[J]. Int J Mol Sci, 2016, 17(7): 1162. doi: 10.3390/ijms17071162 [15] 吴斌. 围绝经期女性血清性激素水平与血脂四项的相关性[J]. 中国妇幼保健, 2021, 36(3): 669. doi: 10.19829/j.zgfybj.issn.1001-4411.2021.03.059 [16] ERSOY GS, SIMSEK EE, VATANSEVER D, et al. Lipid profile and plasma atherogenic index in postmenopausal osteoporosis[J]. North Clin Istanb, 2017, 4(3): 237. [17] ZOLFAROLI I, ORTIZ E, GARCÍA-PÉREZ MÁ, et al. Positive association of high-density lipoprotein cholesterol with lumbar and femoral neck bone mineral density in postmenopausal women[J]. Maturitas, 2021, 147(1): 41. [18] PANAHI N, SOLTANI A, GHASEM-ZADEH A, et al. Associations between the lipid profile and the lumbar spine bone mineral density and trabecular bone score in elderly Iranian individuals participating in the Bushehr Elderly Health Program: a population-based study[J]. Arch Osteoporos, 2019, 14(1): 52. doi: 10.1007/s11657-019-0602-5 [19] WU Y, XING X, YE S. Lipid levels related to osteoporosis in patients with type 2 diabetes[J]. Exp Clin Endocrinol Diabetes, 2019, 127(7): 468. doi: 10.1055/a-0735-9361 [20] ALAY I, KAYA C, CENGIZ H, et al. The relation of body mass index, menopausal symptoms, and lipid profile with bone mineral density in postmenopausal women[J]. Taiwan J Obstet Gynecol, 2020, 59(1): 61. doi: 10.1016/j.tjog.2019.11.009 [21] MAGHBOOLI Z, KHORRAMI-NEZHAD L, ADABI E, et al. Negative correlation of high-density lipoprotein-cholesterol and bone mineral density in postmenopausal Iranian women with vitamin D deficiency[J]. Menopause, 2018, 25(4): 458. doi: 10.1097/GME.0000000000001082 [22] ZHAO H, LI Y, ZHANG M, et al. Blood lipid levels in patients with osteopenia and osteoporosis: a systematic review and meta-analysis[J]. J Bone Miner Metab, 2021, 39(3): 510. doi: 10.1007/s00774-020-01189-9 [23] LI J, CHEN X, LU L, et al. The relationship between bone marrow adipose tissue and bone metabolism in postmenopausal osteoporosis[J]. Cytokine Growth Factor Rev, 2020, 52(1): 88. -

 点击查看大图
图(1)表(6)
计量
- 文章访问数: 2042
- HTML全文浏览量: 1037
- PDF下载量: 10
- 被引次数: 0
