

-
尽管局限性肾癌手术切除后的5年生存率已达到90%以上[1],而手术诱导的慢性肾脏病(CKD)[定义是在有或没有潜在肾脏疾病的病人中,肾切除术后肾小球滤过率(eGFR) < 60 mL·min-1·1.73m-2]却不容忽视,其发生率为22.0%~39.1%[2-3],治疗决策时需权衡恶性肿瘤的风险与肾功能的潜在损失,特别是术前轻度肾功能损害病人。美国泌尿外科协会(AUA)和美国临床肿瘤学会(ASCO)推荐肾癌病人术前进行肾功能筛查和分期,建议将高危病人转诊于肾脏科[2-3],同时进行长期随访,早期发现手术诱导的CKD, 而这些均依赖于肾功能的持续准确的评估。GFR被认为是最有价值的肾功能指标,99mTc-DTPA肾脏动态成像是目前泌尿外科评估肾功能的首选方法,但其受医院硬件及人员资质的限制,且具有一定的放射性,无法作为长期随诊的手段。作为替代方案,临床中常使用GFR估计方程。迄今为止已有84个相关的公式来评估eGFR,然而多数方程非基于亚洲人群发展而来,中国病人适用性并不高[5],另外肾癌病人肾脏存在不同程度的病理改变,GFR的估算数据是否适用肾癌病人更缺少相关评估。鉴于此现状,本研究以99mTc-DTPA所测定的GFR值为参考标准,纳入在临床中以肌酐为指标具有代表性的8个方程,包括湘雅方程(2018年李岱阳等开发)[5]、CKD-EPI(简写EPI)[6]等,评估其对于肾癌病人肾功能的评价适用性,并探讨影响预测公式适用性的因素,为临床上肾癌病人肾功能的评价提供更方便、可靠的方法。
-
选取2018年1月至2019年1月我院泌尿外科因肾肿物为行手术治疗住院病人。纳入标准:(1)原发性肾脏肿瘤且经术后病理证实为肾癌;(2)年龄≥18岁;(3)有完整的病历资料。排除标准:(1)脱水、肺水肿、尿路梗阻及其他严重体液平衡紊乱病人;(2)独立肾或者既往行肾部分切除术的病人、泌尿系结石、结核、畸形、多囊肾等;(3)存在急性肾功能损害的病理因素(尿路梗阻或药物性等);(4)肌肉萎缩、肢体缺如者;(5)使用影响血肌酐水平的药物者;(6)极度消瘦即体质量指数(BMI)≤18 kg/m2。
-
入院时收集所有病人的年龄、性别、身高、体质量、既往史、现病史及肿瘤分期、大小等,术前空腹采集病人血清肌酐等数值,血清肌酐通过罗氏酶法测定(上海罗氏诊断产品有限公司,中国),并利用公式计算病人eGFR,采血当日或次日行肾动态显像法获取GFR,即经肘静脉快速注射99mTc-DTPA,采集双肾血流灌注相和肾摄取与排泄动态图像,用Gate法计算单肾单位GFR,并经体表面积校正[BSA(m2)=体质量(kg)0.425×身高(cm)0.725×0.007184],得出参考肾小球滤过率(rGFR)。
-
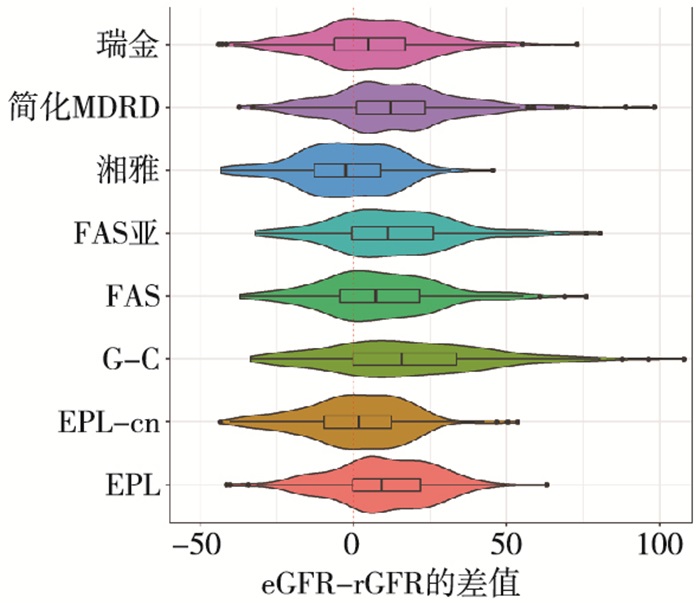
本研究的统计结果由SPSS22.0及R软件分析得出,正态分布数据用均数±标准差表示。偏态数据以中位数(四分位数)〔M(IQR)表示,公式的偏倚采用eGFR与rGFR的均数的差值表示,精确性采用偏倚的标准差表示,准确性用eGFR落入rGFR 30% 范围内的百分比(记为P30)表示,P30越大,说明准确性越好。为了直观反映各公式的一致性,本研究应用小提琴图来展现偏差的分布及密度,中间的黑线为代表偏差的中位数,其与红线的距离可反映偏差的大小,中间矩形框为偏差的四分位间距,可反映各公式的精确性,外部彩色部分反映差值分布的密度图,横轴反映差值分散的程度,纵轴反映各纵坐标位置数据的分布量,可间接反映各估计值的准确性,在接近0的位置分布数值越多,说明公式的准确性好。
-
本研究共纳入病人237例,其中男160例(67.5%),女77例(32.5%),年龄20~83岁,肾透明细胞癌208例,其他(嗜酸、嫌色或乳头状细胞癌)29例,肿瘤直径(4.09±2.23)cm,BMI(25.29±3.06) kg/m2,90例(38.14%)病人患有高血压,42例(17.72%)病人合并有糖尿病,在肾功能指标方面:血清肌酐(74.65±17.21)μmol /L,血清尿素氮(5.18±1.37)mmol /L,血清白蛋白(42.23±3.66)g/L,实测rGFR的平均值为(80.51±20.14)mL·min-1·1.73m-2。
-
8种公式估算的eGFR值为77.82~102.45 mL·min-1· 1.73m-2,8种方程中除湘雅方程低估rGFR外,其他公式均高估rGFR值,rGFR值和估计eGFR值之间的总体关系如表 1及图 1所示,EPI-cn、湘雅、瑞金方程的中心黑线较接近0,说明其偏差值较小,通过表 1可以看到其偏差值在-3.26~5.60,其中EPI-cn的偏差最小,仅为0.23,与各方程比较差异均有统计学意义(P < 0.05);在精确性上,通过图 1可以看到EPI、EPI-cn、湘雅方程的矩形框较窄,说明此3个方程的精确性较好,其中湘雅方程的值最小,为16.56,其次为EPI及EPI-cn,但差异无统计学意义。
公式 eGFR 偏差 精确性 准确性(%) RMSE ≤15 ≤30 ≤50 EPI 90.69 9.62**## 16.99 19.49 109(45.99)# 169(71.31)**## 219(92.41)*## EPI-cn 81.31 0.23## 17.81 17.77 118(49.79) 198(83.54) 228(96.2)# G-C 99.38 18.31**## 29.84 34.96 76(32.07)**## 137(57.81)**## 179(75.53)**## FAS 89.71 8.64**## 19.88 21.63 111(46.84) 171(72.15)**## 217(91.56)*## FAS亚洲 94.25 13.18**## 20.23 24.11 102(43.04)## 162(68.35)**## 206(86.92)**## 湘雅 77.82 -3.26** 16.56 16.84 130(54.85) 205(86.5) 232(97.89)* 简化MDRD 94.84 13.77**## 21.46 25.46 95(40.08)*## 156(65.82)**## 201(84.81)**## 瑞金 86.67 5.60**## 18.86 19.64 107(45.15)## 183(77.22)**## 223(94.09)## 与EPI-cn比较*P < 0.05, **P < 0.01;与湘雅比较#P < 0.05, ##P < 0.01 表 1 各方程估算eGFR与rGFR一致性分析[n;百分率(%)]

图 1 8种估算公式计算的eGFR与rGFR的一致性的小提琴图
在准确性上,图 1可见湘雅方程、EPI-cn、瑞金方程在接近0的位置分布数值越集中,密度高,由表 1中也可以看到湘雅方程、EPI-cn、瑞金方程P30值分别为86.5%、83.54%、77.22%,均高于KDOQI指南中给出的P30值≥75%的标准,而湘雅方程及EPI-cn优于瑞金方程,且差异具有统计学意义(P < 0.01)。而湘雅方程及EPI-cn未有明显的统计学差异(P>0.05)。
-
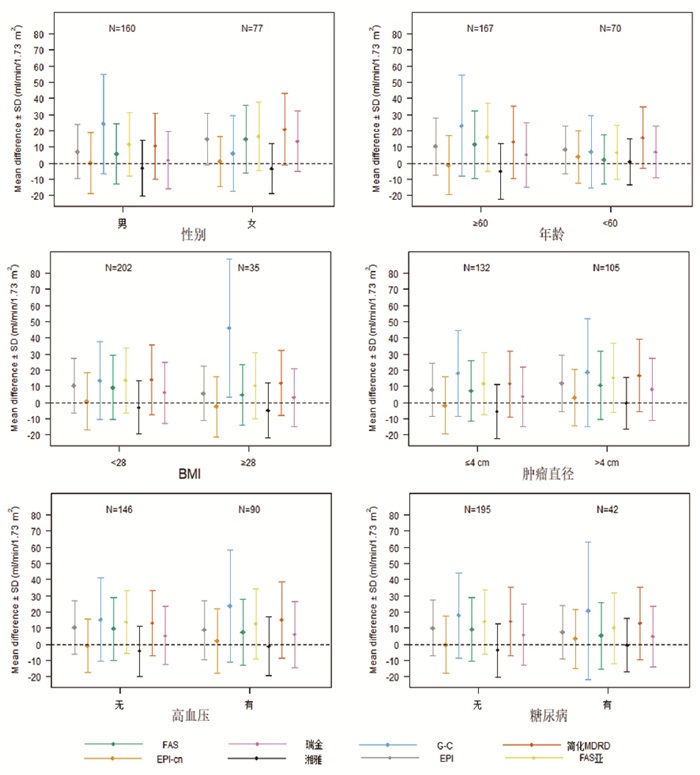
由图 2可以看到,在各亚组中,EPI、G-C方程、FAS、FAS亚洲方程、简化MDRD、瑞金方程这6个估算方程的偏差(eGFR-rGFR,即图中的中心点)均在0以上,即此6个估算方程得出的eGFR均高估实际测量值,其中G-C方程的各组中偏差相对较大,而湘雅方程在不同亚组中的偏差均接近或在0以下,呈现低估状态,EPI-cn在不同的亚组中的偏差一致。相比于6个方程(G-C方程、FAS、FAS亚洲方程、简化MDRD、瑞金方程),EPI-cn与湘雅方程的差值均更接近中线0,均在5.0以内,显著优于其他6个方程。在精确性上(采用差值±1.96标准差,即图中各条线的宽度,宽度越大,表明精确性越差),除G-C方程外,其他各方程的差异较小。

图 2 各亚组的估算公式计算的eGFR与rGFR的偏差和精确度比较偏差和精确度比较
在准确率上,EPI-cn与湘雅方程也表现出了较大的优势,EPI-cn除了在肥胖病人(BMI≥28 kg/m2)的P30值为74.29%,在其他各个亚组中的P30值均大于75%,而湘雅方程在各个亚组中的P30的值均>75%,在女性、≥60岁、BMI < 28 kg/m2、无高血压病人及不同肿瘤大小的病人中>85%,而瑞金方程在男性、≥60岁、BMI < 28 kg/m2、肿瘤≤4 cm、无合并症病人的P30也可达到75%,其余各方程在各亚组中的准确率偏低(见表 2)。
变量 公式 EPI EPI-cn G-C FAS FAS亚洲 湘雅 简化MDRD 瑞金 性别 男 111(69.38) 128(80.0) 78(48.75) 112(70.0) 107(66.88) 134(83.75) 107(66.88) 127(79.38) 女 58(75.32) 70(90.91) 59(76.62) 59(76.62) 55(71.43) 71(92.21) 49(63.64) 56(72.73) 年龄/岁 ≥60 89(70.63) 111(88.1) 69(54.76) 90(71.43) 83(65.87) 113(89.68) 90(71.43) 102(80.95) < 60 80(72.07) 87(78.38) 68(61.26) 81(72.97) 79(71.17) 92(82.88) 66(59.46) 81(72.97) BMI/(kg/m2) < 28 143(70.79) 172(85.15) 128(63.37) 145(71.78) 136(67.33) 176(87.13) 132(65.35) 158(78.22) ≥28 26(74.29) 26(74.29) 9(25.71) 26(74.29) 26(74.29) 29(82.86) 24(68.57) 25(71.43) 肿瘤直径/cm ≤4 99(75.00) 111(84.09) 74(56.06) 101(76.52) 96(72.73) 114(86.36) 95(71.97) 106(80.3) >4 70(66.67) 87(82.86) 63(60.00) 70(66.67) 66(62.86) 91(86.67) 61(58.1) 77(73.33) 高血压 无 110(75.34) 128(87.67) 87(59.59) 109(74.66) 104(71.23) 133(91.1) 104(71.23) 120(82.19) 有 58(64.44) 69(76.67) 49(54.44) 61(67.78) 57(63.33) 71(78.89) 51(56.67) 62(68.89) 糖尿病 无 139(71.28) 164(84.1) 111(56.92) 140(71.79) 131(67.18) 170(87.18) 128(65.64) 152(77.95) 有 30(71.43) 34(80.95) 26(61.9) 31(73.81) 31(73.81) 35(83.33) 28(66.67) 31(73.81) 表 2 各种eGFR公式在不同亚组中的准确率[P30;n(%)]
-
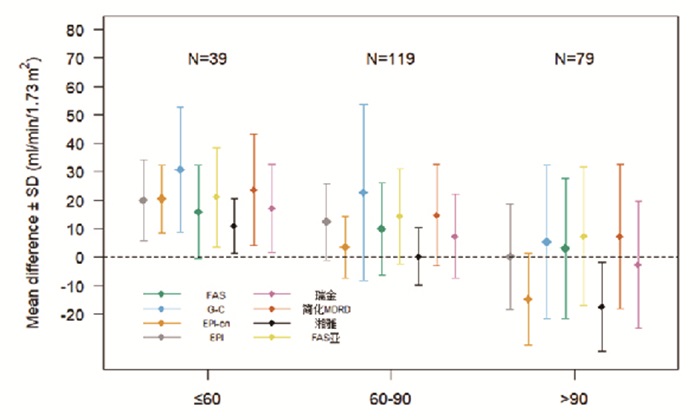
将rGFR以90和60为界分为3组,rGFR>90 mL·min-1·1.73m-2组;rGFR 60~90 mL·min-1·1.73m-2组,rGFR < 60 mL·min-1·1.73m-2组,根据KIDGOCKD分期的标准,相当于G1期、G2期、G3期及以上,由图 1可以看到rGFR>90 mL·min-1·1.73m-2组(即G1期),EPI-cn及湘雅方程及瑞金方程在中心点都在0以下,呈现低估状态,EPI-cn及湘雅方程更加明显,偏差值在-14.68~-17.38,而EPI及FAS公式最接近0点,偏差值最小。而在精确性上,湘雅方程、EPI-cn、EPI线条宽度较窄且偏差方差值小,说明此3个方程的精确性较好,由表 2可以看到各估算公式的准确率波动于81.01%~88.61%,均高于75%,说明各公式的准确性较好。综上所述对于rGFR>90 mL·min-1·1.73m-2组(即G1期),EPI方程与rGFR的一致性最好。
在rGFR 60~90 mL·min-1·1.73m-2组中,由图 3可以看到各组数据的中心均高于0,公式均呈现高估状态,而湘雅方程及EPI-cn的中心接近于0,且线条宽度窄,表 3显示湘雅方程及EPI-cn的偏差仅为0.25及3.25,两者的P30值可达到94.96%及97.48%,因此在rGFR60~90 mL·min-1·1.73m-2组(即G2期),湘雅方程及EPI-cn均与rGFR保持较高的一致性,且湘雅方程的一致性更佳。

图 3 各估算公式在不同rGFR水平一致性的比较
rGFR分组 肌酐水平/(mmol/L) 指标 EPI EPI-cn G-C FAS FAS亚洲 湘雅 简化MDRD 瑞金 >90 mL·min-1·1.73m-2 63.0±11.9 eGFR 104.7±17.9 89.8±13.7 109.8±27.6 107.6±24.9 111.8±24.9 87.1±13.7 111.8±24.9 101.8±21.8 偏差 0.21 -14.68 5.38 3.11 7.39 -17.38 7.30 -2.69 精确性 18.58 16.18 27.06 24.60 24.39 15.71 25.33 22.24 ≤30 71(89.9) 70(88.6) 64(81.0) 65(82.3) 66(83.54) 65(82.3) 66(83.54) 68(86.1) 60~90 mL·min-1·1.73m-2 76.7±14.9 eGFR 87.6±14.0 78.7±9.4 97.8±29.4 85.0±16.5 89.5±16.8 75.4±8.9 90.0±17.5 82.5±14.5 Bias 12.44 3.52 22.79 9.92 14.42 0.25 14.79 7.32 Precision 13.44 10.94 30.93 16.28 16.80 10.16 17.69 14.66 ≤30 87(73.1) 113(94.9) 63(52.9) 90(75.6) 84(70.6) 116(97.5) 79(66.4) 95(79.8) <60 mL·min-1·1.73m-2 89.6±18.2 eGFR 71.9±14.8 72.4±10.9 82.8±22.4 67.8±16.9 73.1±17.8 62.6±9.2 75.7±20.4 69.1±16.1 Bias 20.05 20.43 30.82 15.92 21.13 10.65 23.76 17.13 Precision 14.25 12.04 22.04 16.28 17.45 9.66 19.49 15.43 ≤30 11(28.2) 15(38.5) 10(25.6) 16(41.0) 12(30.8) 27(69.5) 11(28.2) 20(51.3) 表 3 不同rGFR水平下8种eGFR公式的偏差、精确性及准确率[n; 百分率(%)]
在rGFR < 60 mL·min-1·1.73m-2组中,各组数据的中心均在0之上,呈明显高估状态,G-C公式的偏差最大,值为30.82,湘雅方程的偏差相对最小,但其值仍为10.65,湘雅方程线条宽度最窄,G-C公式最宽,说明湘雅方程在8个估算方程中的精确性最佳,而在准确性上,各估算方程P30值波动于25.64%~69.54%,湘雅方程P30值最大为69.54%,相比于其他7个估算公式,湘雅公式的偏倚、精确性及准确性较好,但参考KDOQI指南中给出的P30值≥75%的标准,其准确性仍偏低,8个估算方程计算出的eGFR在rGFR < 60 mL·min-1·1.73m-2组(即G3期及以上)中均存在一定的误差,一致性欠佳。
-
肾癌是泌尿系统最常见的恶性肿瘤,通常无症状,在影像学检查中意外发现。由于肾癌与CKD有着共同的危险因素(高龄、吸烟史、合并糖尿病、高血压和肥胖等),据统计有超过25%的肾癌的病人在诊断时存在潜在的CKD[7], 因此eGFR的测量对于预测、处理及延缓CKD非常重要。
本研究结果显示, 在我国肾癌病人eGFR评估上,基于欧美人群发展起来的公式(G-C方程、简化MDRD、EPI、FAS)无论在准确率上还是精确率上均不及经中国人群下改良或基于本土人群开发的公式(瑞金方程、EPI-cn、湘雅方程),这与既往的研究[5, 8-9]结果一致,GFR的估算方程没有任何生理学基础, 只是一个基于经验的统计学回归方程, 建立计算公式时采用的人群是影响公式临床适用性最为重要的因素之一[9],中国人群肌肉含量和膳食习惯导致肌酐生成量低于欧美人种,这使得基于欧美人群建立的eGFR估算方程在中国人群的适用性相对较弱。
而在经中国人群改良或基于本土人群开发的公式中,湘雅方程、EPI-cn(改良EPI方程)优于瑞金方程,且两者在各亚组的分析结果中也显示较低的偏差及较高的准确性及精确性,肾癌主要通过肿瘤本身直接侵犯肾脏,或合并基础肾脏疾病,或因治疗过程中造成的急慢性损伤对于病人的肾功能造成影响[12],这与既往研究[8, 13-14]显示的EPI方程在癌症、代谢性肾病及梗阻性肾病病人中均较瑞金方程具有较高的准确性的结果基本一致。另外吴燕等[9]发现经亚洲人群改良的EPI亚洲方程较EPI方程在我国肾癌病人中具有更好的诊断性能,而LIU等[8, 15]发现EPI-cn方程在非CKD病人中的准确性及精确性均较EPI亚洲方程及原始EPI方程高。由于肾癌行手术治疗的病人中CKD病人比例相对低,这也使得EPI-cn在肾癌病人的eGFR评估中的适用性较好。湘雅方程是2018年新开发的估算方程,充分考虑我国的多民族性,基于多中心,大样本数据,验证结果显示它比C-G、MDRD和EPI方程以及从中国或亚洲人口中发展出来的方程更准确[5],另外其以99mTc-DTPA肾动态成像测定GFR为金标准,且纳入人群中包含恶性肿瘤及糖尿病等病人,在方法学及研究人群与本研究具有较强的同质性,因此在肾癌病人中也表现出较好的准确性及精确性。
各亚组的比较分析显示,除在肥胖病人(BMI < 28 kg/m2)中,EPI-cn方程与湘雅方程一样,也表现出较高的准确性及精确性,而在肥胖病人中湘雅方程更具优势。进一步rGFR分组比较显示EPI-cn方程及湘雅方程在rGFR为60~90 mL·min-1·1.73m-2组(即肾功能轻度下降组)与rGFR呈现出较高的一致性,湘雅方程更佳,其准确性可达到97.48%,而其在rGFR>90 mL·min-1·1.73m-2(即肾功能正常)的病人中呈现明显的低估状态,其精确性及准确性均不及EPI方程,在rGFR < 60 mL·min-1·1.73m-2(肾功能下降组)的病人中,所有的方程均呈现高估状态,尽管湘雅方程偏差、准确性及精确性优于其他各方程,但总体准确性仍欠佳,GFR评估方程是多元回归分析的结果,从统计学的角度分析,最佳适用范围在开发样本的GFR附近,当方程用于GFR水平较高的病人时会出现低估现象,而用于GFR水平较低的病人时会出现高估现象[13],这与EPI公式在建立之初即为了改善eGFR公式在GFR较高的人群中的适用性,而湘雅方程开发时即在rGFR为60~90 mL·min-1·1.73m-2表现最高的准确性不谋而合。
在rGFR < 60 mL·min-1·1.73m-2组,各方程与rGFR的一致性均较低,这一方面可能是该组样本量较小,造成结果的偏倚,另一方面该组rGFR虽小于 < 60 mL·min-1·1.73m-2,但其平均肌酐却在正常值的范围内(89.64±18.25)μmol/L,这与既往研究也提及的肌酐作为标记物可能具有滞后性,在早期肾功能下降时未出现明显异常,致使各方程均呈现高估状态有关[13]。因此建议探寻更敏感性的血或尿的标记物以利于准确的反映肾脏的滤过功能,既往也有文献报告胱抑素(Cys C)可在肌酐尚未升高时更敏感反映肾脏的滤过功能,但由于Cys C参与细胞凋亡、免疫反应等功能,而肾癌病人局部高代谢、免疫力低下可能会干扰其水平,因此其在肾癌中的特异性仍有待于进一步的研究[10, 17]。
本研究发现,EPI方程在肾功能正常者中与rGFR一致性较好,湘雅方程在肾功能轻度下降的病人中具有较好的准确性,而各个公式对于肾癌病人肾功能明显下降组均存在一定的偏差,因此对于肾癌病人术前肾功能的评估建议尽可能采用金标准测量,若在实际存在一定困难时采用eGFR和金标准测量相结合的策略,但对于需行肾根治性切除时、孤独肾、eGFR < 60 mL·min-1·1.73m-2及存在高CKD风险的病人(既往肾病、糖尿病、血压控制不良、蛋白尿等)等病人必须考虑采用准确测量法以更好的制定临床决策[16]。
对于术后肾功能的监测,由于肾血流图等标准测量法存在一定的放射性,很难作为长期随诊的手段。因此eGFR估算公式更具有临床实用性,2012国际肾脏病组织“肾病: 改善全球结果”(KDIGO)将GFR下降速率超过每年5 mL·min-1·1.73m-2定义为CKD进展[18]。而实现GFR下降减少40%~50%的临床干预(例如,从每年5.0 mL·min-1·1.73m-2降至每年2.0或2.5 mL·min-1·1.73m-2被认为能有效预防高危病人肾功能的丧失(如控制基础病、改变生活方式、谨慎用药,权衡造影剂的使用)[18]。尽管手术诱导的CKD, 其CKD进展和死亡的风险似乎低于慢性肾病病人,但术后持续性CKD管理仍需等同于慢性肾病病人的管理[2],因此关注eGFR的动态变化尤为重要。目前临床外科医生对于肾癌病人术后肾功能监测往往只关注与血肌酐水平,而血肌酐的正常值范围较广,当其高于正常上限时,GFR可能已下降至正常的一半[16],建议实验室在报告血清肌酐浓度的同时提供eGFR值及其估算公式,以供临床进行参考,对于肾癌病人可联合参考EPI公式及湘雅公式估算的eGFR,同时关注eGFR的下降率, 计算公式为(近期eGFR-初期eGFR)/初期eGFR*100%[19],早期发现病人肾功能的下降,及时进行处理。对于术后新发CKD或者CKD进展高风险的病人,建议肾内科及泌尿外科联合复诊。
总之,本研究发现在肾癌病人肾功能的评估中,不同eGFR公式间与rGFR存在着一定的差异性,尤其各在肾功能下降组中,因此建议术前肾功能评估时建议尽可能采用肾血流图等标准测量法,eGFR变化率对术后肾功能的动态监测更有价值,基于各公式存在的不足,希望今后的研究在探讨肾癌病人在不同阶段肾功能的评估方法的同时寻求更敏感的反映肾功能的指标,以更客观地评估肾癌病人的肾功能,延缓CKD的进展。
8种肾小球滤过率方程在肾癌术后病人中的临床应用及评价
Clinical application and evaluation of eight estimation equations for glomerular filtration rate in patients with post-operative renal carcinoma
-
摘要:
目的评价8种不同估算肾小球滤过率(eGFR)方程在肾癌病人肾功能评价中的适用性。 方法纳入行手术治疗的肾癌病人237例,以99mTc-DTPA肾动态显像测定肾小球滤过率(GFR)作为参考标准(rGFR),与临床中具有一定代表性以肌酐为指标的8个eGFR估算方程做比较,并根据体质量指数(BMI)、年龄、rGFR等进行分组,评估其是否影响eGFR估算方程与rGFR的一致性。 结果与rGFR相比,8种方程中除湘雅方程略低估GFR外,其他公式均高估GFR值,在总体及不同组别的比较中湘雅方程估算的eGFR的准确性及精确性均最高,其次为改良CKD-EPI(EPI-cn),而G-C方程的准确性及精确性最差。而在不同rGFR分组中,EPI方程估算的eGFR在rGFR>90 mL·min-1·1.73m-2组中与rGFR的一致性最好;湘雅方程在rGFR 60~90 mL·min-1·1.73m-2组中的准确性及精确性最佳;而在rGFR < 90 mL·min-1·1.73m-2组中,各方程均呈现明显高估状态。8个估算方程中虽湘雅方程的准确性及精确性最好,但其准确性(P30值)也仅为69.54%,总体与rGFR的一致性仍欠佳。 结论不同eGFR公式评估肾癌病人肾功能与rGFR存在着一定的差异性,尤其在肾功能下降时。建议术前肾功能评估尽可能采用肾动态显像。对于术后肾功能的监测可联合参考EPI公式及湘雅公式估算的eGFR,同时重点关注eGFR的下降率。 Abstract:ObjectiveTo evaluate the diagnostic performances of eight estimation equations for estimated glomerular filtration rate(eGFR)in patients with post-operative renal carcinoma. MethodsA total of 237 patients with post-operative renal carcinoma were included as study objects.The glomerular filtration rate(GFR) measured by 99mTc-DTPA renal dynamic imaging as reference(rGFR) were compared with the eight eGFR estimation equations respectively.Patients were divided into different groups according to body mass index, age, rGFR ect., and the clinical applicability of various equations in each group was compared. ResultsCompared with rGFR, the GFR values were overestimated by all the other equations except Xiangya equation.The eGFR from the Xiangya equation demonstrated the highest precision and accuracy in whole population and almost all subgroups, followed by modified CKD-EPI equation(EPI-cn), while the G-C equation showed the poorest predictive value in precision and accuracy.The eGFR from EPI equation had the highest consistency with rGFR in rGFR >90 mL·min-1·1.73m-2 group; Xiangya equation demonstrated the best predictive value in rGFR 60-90 mL·min-1·1.73m-2 group; in the rGFR < 60 mL·min-1·1.73m-2 group, all equations were significantly overestimated.The P30 value of Xiangya equation, which had the highest precision and accuracy in all estimation equations, was only 69.54%, and the overall consistency with rGFR was still poor. ConclusionsThere are some differences between eGFR from the equations and rGFR, especially when renal function declines.Renal dynamic imaging should be used in the preoperative renal function evaluation.The EPI and Xiangya equations should be applied together in the estimation of eGFR in postoperative renal function, and the impact of eGFR decline rate on the predictive value needs extra attention. -
Key words:
- renal neoplasms /
- glomerular filtration rate /
- evaluation equation
-
表 1 各方程估算eGFR与rGFR一致性分析[n;百分率(%)]
公式 eGFR 偏差 精确性 准确性(%) RMSE ≤15 ≤30 ≤50 EPI 90.69 9.62**## 16.99 19.49 109(45.99)# 169(71.31)**## 219(92.41)*## EPI-cn 81.31 0.23## 17.81 17.77 118(49.79) 198(83.54) 228(96.2)# G-C 99.38 18.31**## 29.84 34.96 76(32.07)**## 137(57.81)**## 179(75.53)**## FAS 89.71 8.64**## 19.88 21.63 111(46.84) 171(72.15)**## 217(91.56)*## FAS亚洲 94.25 13.18**## 20.23 24.11 102(43.04)## 162(68.35)**## 206(86.92)**## 湘雅 77.82 -3.26** 16.56 16.84 130(54.85) 205(86.5) 232(97.89)* 简化MDRD 94.84 13.77**## 21.46 25.46 95(40.08)*## 156(65.82)**## 201(84.81)**## 瑞金 86.67 5.60**## 18.86 19.64 107(45.15)## 183(77.22)**## 223(94.09)## 与EPI-cn比较*P < 0.05, **P < 0.01;与湘雅比较#P < 0.05, ##P < 0.01  下载: 导出CSV
表 2 各种eGFR公式在不同亚组中的准确率[P30;n(%)]
变量 公式 EPI EPI-cn G-C FAS FAS亚洲 湘雅 简化MDRD 瑞金 性别 男 111(69.38) 128(80.0) 78(48.75) 112(70.0) 107(66.88) 134(83.75) 107(66.88) 127(79.38) 女 58(75.32) 70(90.91) 59(76.62) 59(76.62) 55(71.43) 71(92.21) 49(63.64) 56(72.73) 年龄/岁 ≥60 89(70.63) 111(88.1) 69(54.76) 90(71.43) 83(65.87) 113(89.68) 90(71.43) 102(80.95) < 60 80(72.07) 87(78.38) 68(61.26) 81(72.97) 79(71.17) 92(82.88) 66(59.46) 81(72.97) BMI/(kg/m2) < 28 143(70.79) 172(85.15) 128(63.37) 145(71.78) 136(67.33) 176(87.13) 132(65.35) 158(78.22) ≥28 26(74.29) 26(74.29) 9(25.71) 26(74.29) 26(74.29) 29(82.86) 24(68.57) 25(71.43) 肿瘤直径/cm ≤4 99(75.00) 111(84.09) 74(56.06) 101(76.52) 96(72.73) 114(86.36) 95(71.97) 106(80.3) >4 70(66.67) 87(82.86) 63(60.00) 70(66.67) 66(62.86) 91(86.67) 61(58.1) 77(73.33) 高血压 无 110(75.34) 128(87.67) 87(59.59) 109(74.66) 104(71.23) 133(91.1) 104(71.23) 120(82.19) 有 58(64.44) 69(76.67) 49(54.44) 61(67.78) 57(63.33) 71(78.89) 51(56.67) 62(68.89) 糖尿病 无 139(71.28) 164(84.1) 111(56.92) 140(71.79) 131(67.18) 170(87.18) 128(65.64) 152(77.95) 有 30(71.43) 34(80.95) 26(61.9) 31(73.81) 31(73.81) 35(83.33) 28(66.67) 31(73.81)
下载: 导出CSV
表 3 不同rGFR水平下8种eGFR公式的偏差、精确性及准确率[n; 百分率(%)]
rGFR分组 肌酐水平/(mmol/L) 指标 EPI EPI-cn G-C FAS FAS亚洲 湘雅 简化MDRD 瑞金 >90 mL·min-1·1.73m-2 63.0±11.9 eGFR 104.7±17.9 89.8±13.7 109.8±27.6 107.6±24.9 111.8±24.9 87.1±13.7 111.8±24.9 101.8±21.8 偏差 0.21 -14.68 5.38 3.11 7.39 -17.38 7.30 -2.69 精确性 18.58 16.18 27.06 24.60 24.39 15.71 25.33 22.24 ≤30 71(89.9) 70(88.6) 64(81.0) 65(82.3) 66(83.54) 65(82.3) 66(83.54) 68(86.1) 60~90 mL·min-1·1.73m-2 76.7±14.9 eGFR 87.6±14.0 78.7±9.4 97.8±29.4 85.0±16.5 89.5±16.8 75.4±8.9 90.0±17.5 82.5±14.5 Bias 12.44 3.52 22.79 9.92 14.42 0.25 14.79 7.32 Precision 13.44 10.94 30.93 16.28 16.80 10.16 17.69 14.66 ≤30 87(73.1) 113(94.9) 63(52.9) 90(75.6) 84(70.6) 116(97.5) 79(66.4) 95(79.8) <60 mL·min-1·1.73m-2 89.6±18.2 eGFR 71.9±14.8 72.4±10.9 82.8±22.4 67.8±16.9 73.1±17.8 62.6±9.2 75.7±20.4 69.1±16.1 Bias 20.05 20.43 30.82 15.92 21.13 10.65 23.76 17.13 Precision 14.25 12.04 22.04 16.28 17.45 9.66 19.49 15.43 ≤30 11(28.2) 15(38.5) 10(25.6) 16(41.0) 12(30.8) 27(69.5) 11(28.2) 20(51.3)
下载: 导出CSV
-
[1] BRAY F, FERLAY J, SOERJOMATARAM I, et al. Global cancer statistics 2018: GLOBOCAN estimates of incidence and mortality worldwide for 36 cancers in 185 countries[J]. CA Cancer J Clin, 2018, 68(6): 394. doi: 10.3322/caac.21492 [2] LANE BR, CAMPBELL SC, DEMIRJIAN S, et al. Surgically induced chronic kidney disease may be associated with a lower risk of progression and mortality than medical chronic kidney disease[J]. J Urol, 2013, 189(5): 1649. doi: 10.1016/j.juro.2012.11.121 [3] YOU SH, SUNG DJ, YANG KS, et al. Predicting the development of surgically induced chronic kidney disease after total nephrectomy using body surface area-adjusted renal cortical volume on CT angiography[J]. AJR Am J Roentgenol, 2019, 212(2): 32. doi: 10.2214/AJR.18.20135 [4] HU SL, WEISS RH. Management of the incidental kidney mass in the nephrology clinic[J]. Clin J Am Soc Nephrol, 2018, 13(9): 1407. doi: 10.2215/CJN.00860118 [5] LI DY, YIN WJ, YI YH, et al. Development and validation of a more accurate estimating equation for glomerular filtration rate in a Chinese population[J]. Kidney Int, 2019, 95(3): 636. doi: 10.1016/j.kint.2018.10.019 [6] LEVEY AS, STEVENS LA, SCHMID CH, et al. A new equation to estimate glomerular filtration rate[J]. Ann Intern Med, 2009, 150(9): 604. doi: 10.7326/0003-4819-150-9-200905050-00006 [7] HENRIKSEN KJ, CHANG A. The importance of nephropathology in kidney cancer[J]. Semin Nephrol, 2020, 40(1): 69. doi: 10.1016/j.semnephrol.2019.12.008 [8] LIU X, GAN X, CHEN J, et al. A new modified CKD-EPI equation for Chinese patients with type 2 diabetes[J]. PLoS One, 2014, 9(10): e109743. doi: 10.1371/journal.pone.0109743 [9] 吴燕, 谌海兰, 侯玉磊, 等. 不同肾小球滤过率估算方程在术前肾癌患者中的临床应用研究[J]. 重庆医学, 2017, 46(8): 1066. doi: 10.3969/j.issn.1671-8348.2017.08.019 [10] STEUBL D, INKER LA. How best to estimate glomerular filtration rate Novel filtration markers and their application[J]. Curr Opin Nephrol Hypertens, 2018, 27(6): 398. doi: 10.1097/MNH.0000000000000444 [11] 王寅, 王蓓莉, 郭玮, 等. 肾小球滤过率计算公式的发展和比较[J]. 检验医学, 2015, 30(7): 668. doi: 10.3969/j.issn.1673-8640.2015.07.002 [12] LAM AQ, HUMPHREYS BD. Onco-nephrology: AKI in the cancer patient[J]. Clin J Am Soc Nephrol, 2012, 7(10): 1692. doi: 10.2215/CJN.03140312 [13] CHANCHAROENTHANA W, WATTANATORN S, VADCHARAVIVAD S, et al. Agreement and precision analyses of various estimated glomerular filtration rate formulae in cancer patients[J]. Sci Rep, 2019, 9(1): 19356. doi: 10.1038/s41598-019-55833-0 [14] CHEN M, XIA J, PEI G, et al. A more accurate method acquirement by a comparison of the prediction equations for estimating glomerular filtration rate in Chinese patients with obstructive nephropathy[J]. BMC Nephrol, 2016, 17(1): 150. doi: 10.1186/s12882-016-0345-0 [15] XIE P, HUANG JM, LI Y, et al. The modified CKD-EPI equation may be not more accurate than CKD-EPI equation in determining glomerular filtration rate in Chinese patients with chronic kidney disease[J]. J Nephrol, 2017, 30(3): 397. doi: 10.1007/s40620-016-0307-4 [16] TREVISANI F, DI MARCO F, CAPITANIO U, et al. Renal function assessment gap in clinical practice: an awkward truth[J]. Kidney Blood Press Res, 2020, 45(2): 166. doi: 10.1159/000504649 [17] 余菡青, 牛建英. 恶性肿瘤患者肾功能的评估[J]. 肾脏病与透析肾移植杂志, 2019, 28(6): 570. doi: 10.3969/j.issn.1006-298X.2019.06.015 [18] 赖玮婧, 刘芳, 付平. 慢性肾脏病评估及管理临床实践指南解读——从K/DOQI到KDIGO[J]. 中国实用内科杂志, 2013, 33(6): 448. [19] APPEL LJ, ARIMA H, CHADBAN SJ, et al. Decline in estimated glomerular filtration rate and subsequent risk of end-stage renal disease and mortality[J]. JAMA, 2014, 311(24): 2518. doi: 10.1001/jama.2014.6634 [20] COCKCROFT DW, GAULT MH. Prediction of creatinine clearance from serum creatinine[J]. Nephron, 1976, 16(1): 31. doi: 10.1159/000180580 [21] POTTEL H, HOSTE L, DUBOURG L, et al. An estimated glomerular filtration rate equation for the full age spectrum[J]. Nephrol Dial Transplant, 2016, 31(5): 798. doi: 10.1093/ndt/gfv454 [22] JEONG TD, CHO EJ, LEE W, et al. Accuracy assessment of five equations used for estimating the glomerular filtration rate in korean adults[J]. Ann Lab Med, 2017, 37(5): 371. doi: 10.3343/alm.2017.37.5.371 [23] MA Y C, ZUO L, CHEN JH, et al. Modified glomerular filtration rate estimating equation for Chinese patients with chronic kidney disease[J]. J Am Soc Nephrol, 2006, 17(10): 2937. doi: 10.1681/ASN.2006040368 [24] CHANG H, YE SD. Application of modified glomerular filtration rate estimation equations in chinese diabetic patients with chronic kidney diseases[J]. West Indian Med J, 2015, 64(3): 209. -

 点击查看大图
图(3)表(3)
计量
- 文章访问数: 2337
- HTML全文浏览量: 933
- PDF下载量: 9
- 被引次数: 0
