


-
肺癌是全球癌症相关死亡的主要原因[1],非小细胞肺癌(nonsmall-cell lung cancer, NSCLC)最常见的基因突变是表皮生长因子受体(epidermal growth factor receptor,EGFR)突变[2]。与野生型EGFR病人相比,酪氨酸激酶抑制剂(tyrosine kinase inhibitors, TKIs)对EGFR突变病人有着更高的应答率[3],能够提高病人的无进展生存期[4],改善生活质量,因此TKIs被美国国家综合癌症网络(national comprehensive cancer network, NCCN)推荐为NSCLC的一线治疗方法[5]。活检组织病理学标本最常用于检测EGFR的突变状态,但是由于肿瘤的异质性、取样的偏差、耗时的程序、有创并且增加了癌症转移的风险[6],一定程度上限制了其在EGFR突变检测中的应用。影像组学是从影像图像中高通量地提取大量影像信息,将视觉影像信息转化为深层次的定量影像特征来进行量化研究,不仅有效地解决了肿瘤异质性难以定量评估的问题,而且无创,可以重复进行[7]。影像组学在肺部病变的定性、肺癌的分级与分期、肺癌的疗效评估和预后预测等方面已有较为广泛的研究[8-9],本文旨在探究影像组学联合临床特征在预测肺腺癌EGFR突变状态中的价值。
-
选取2019-2020年蚌埠医学院第一附属医院收治的125例经病理证实为肺腺癌的病人,男51例,女74例,年龄29~82岁。纳入标准:(1)术前2周内接受完整的胸部CT检查;(2) CT检查前未接受任何治疗;(3)病理证实为肺腺癌;(4)临床资料完整。排除标准:(1)术前2周内未接受完整的胸部CT检查(6例);(2)未进行根治性手术治疗(8例);(3)CT检查前接受过系统性或局部性治疗(3例);(4)术后病理证实为非肺腺癌(8例);(5)合并阻塞性肺不张或其他肺部病变(8例);(6)临床资料不完整(3例)。
入组病人中,EGFR突变77例,野生型EGFR 48例。按照6:4随机分成训练组(共74例,其中EGFR突变49例,野生型EGFR 25例)和验证组(共51例,其中EGFR突变28例,野生型EGFR 23例)。临床资料包括年龄、性别、吸烟史。本研究经医院伦理委员会审核通过。
-
所有病人均排除CT检查禁忌证,检查前训练病人吸气后屏气。病人取仰卧位,扫描范围为肺尖至肺底。采用GE Revolution 256排CT(GE Healthcare,USA),管电压120 kV,管电流380 mA,螺距0.992∶ 1,视野444 mm×444 mm,扫描层厚和层间距均为5 mm,窗宽800 HU,窗位-700 HU,图像重建层厚为0.625 mm。
-
在不告知病理结果的前提下,由两名放射科医生对每位病人进行CT征象评估,意见不一致时,经讨论达成一致后记录主观评估结果。评估项目包括病灶形态(规则或不规则)、密度[实性或磨玻璃(ground glass opacity,GGO)]、边界(清晰或模糊)、分叶征、毛刺征、晕征、钙化、瘤内坏死、空泡、空洞、空气支气管征、外周纤维化、胸膜牵拉、胸膜接触、临近胸膜增厚、胸腔积液、周围肺气肿、肺门/纵隔淋巴结肿大。
具体评价标准(1)病灶大小:目标病灶横断面的最大直径。(2)形态规则:病灶形态呈圆形、椭圆形,包括2或3个波状起伏。(3)形态不规则:病灶形态既不是圆形、椭圆形,也不是分叶。(4)分叶:定义为>3个波状起伏。(5)毛刺:从肿块上突出的尖锐线条。(6)晕征:为磨玻璃影围绕结节或肿块。(7)GGO:为CT图像上肺密度轻度增加,支气管血管束清晰可辨,形似磨玻璃。(8)空泡:肺部肿块内残留的含气肺组织或支气管形成的直径3 mm以内的含气低密度区。(9)空洞:病灶内直径3 mm以上的含气低密度区。(10)空气支气管征:在实变区中可见到含气的支气管分支影。(11)胸膜牵拉:从断层图像显示为近脏层胸膜面见小三角形影或小喇叭状阴影,三角形的底部在胸壁,尖指向结节,结节与三角形影之间可为线状影相连。(12)周围肺气肿:指终末细支气管远端气腔出现持久异常的扩张,并伴有肺泡和细支气管的破坏、肺透亮度增高。(13)肺门/纵隔淋巴结肿大:淋巴结短径>15 mm。
-
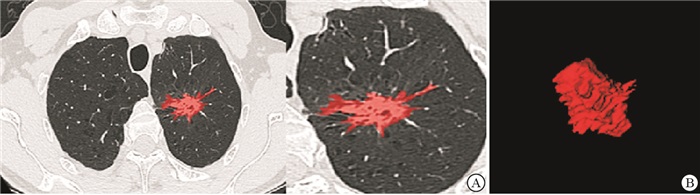
将CT平扫薄层图像上传至“医准-达尔文”智能科研平台(www.yizhun-ai.com),在病灶边界手动逐层勾画肿瘤的三维感兴趣体积(volume of interest,VOI)(见图 1、2),提取影像组学特征。采用“最小最大值归一化”进行数据预处理,将每一维度特征线性拉伸到指定的区间[1],以使算法收敛更快,得到更加合理的模型。采用LASSO-Logistic算法经验性地保留50个影像组学。经过5折交叉验证后确定LASSO最优调谐参数alpha值,并绘制LASSO系数剖面图。在最优调谐参数alpha处绘制垂直线,得到6个衰减系数非零的影像组学特征。

图 1 男, 56岁,野生型EGFR肺腺癌病人

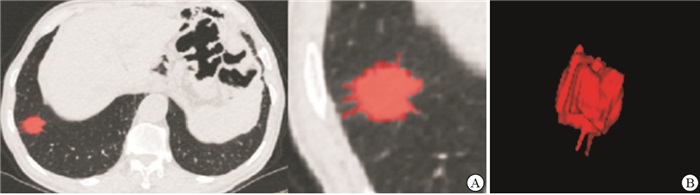
图 2 女性, 66岁, 突变型EGFR肺腺癌病人
-
采用支持向量机(support vector machine, SVM)分类器,结合临床因素、CT征象构建临床模型,结合影像组学特征构建影像组学模型,结合临床因素、CT征象及影像组学特征构建联合模型。
-
采用t检验、χ2检验以及logistic回归分析。
-
无吸烟史、毛刺征、GGO以及胸膜牵拉与肺腺癌EGFR突变状态显著相关(P<0.05)(见表 1)。
项目 训练组 验证组 EGFR(-)(n=25) EGFR(+)(n=49) χ2 P EGFR(-)(n=23) EGFR(+)(n=28) χ2 P 年龄/岁 63.24±12.89 60.47±8.27 0.98* >0.05 63.21±10.31 62.75±9.39 0.17* >0.05 性别 男
女12 (48.0)
13 (52.0)18 (36.7)
31 (63.3)0.87 >0.05 15 (65.2)
8 (34.8)6 (21.4)
22 (78.6)10.00# <0.01 吸烟史 有
无5 (20.0)
20 (80.0)23 (46.9)
26 (53.1)5.11 <0.05 5 (21.7)
18 (78.3)15 (53.6)
13 (46.4)5.36 <0.05 大小/cm 2.80(1.35-5.40) 3.00(2.10-4.00) 0.532△ >0.05 3.27±1.85 3.34±1.67 0.14* >0.05 形态 规则
不规则16 (64.0)
9 (36.0)26 (53.1)
23 (46.9)0.81 >0.05 7 (30.4)
16 (69.6)14 (50.0)
14 (50.0)2.00 >0.05 边界 清晰
模糊24 (96.0)
1 (4.0)42 (85.7)
7 (14.3)0.91# >0.05 4 (17.4)
19 (82.6)1(3.6)
27 (96.4)1.39 >0.05 分叶征 有
无18 (72.0)
7 (28.0)41 (83.7)
8 (16.3)1.40 >0.05 18(78.3)
5 (21.7)23 (82.1)
5 (17.9)0.01 >0.05 毛刺征 有
无7 (28.0)
18 (72.0)26 (53.1)
23 (46.9)4.21 <0.05 7 (30.4)
16(69.6)17 (60.7)
11 (39.3)4.65 <0.05 病灶密度 磨玻璃
实性13 (52.0)
12 (48.0)12 (24.5)
37 (75.5)5.60 <0.05 14 (60.9)
9 (39.1)7 (25.0)
21 (75.0)6.71 <0.01 晕征 有
无5 (20.0)
20 (80.0)14 (28.6)
35 (71.4)0.64 >0.05 10 (43.5)
13 (56.5)8 (28.6)
20 (71.4)1.23 >0.05 钙化 有
无3 (12.0)
22 (88.0)12 (24.5)
37 (75.5)1.60 >0.05 2 (8.7)
21 (91.3)5 (17.9)
23 (82.1)0.29# >0.05 瘤内坏死 有
无4 (16.0)
21 (84.0)15 (30.6)
34 (69.4)1.17 >0.05 6 (26.1)
17 (73.9)6 (21.4)
22 (78.6)0.15 >0.05 空泡征 有
无6 (24.0)
19 (76.0)12 (24.5)
37 (75.5)0.00 >0.05 4 (17.4)
19 (82.6)5 (17.9)
23 (82.1)0.11# >0.05 空洞征 有
无1 (4.0)
24 (96.0)1 (2.0)
48 (98.0)— 1.00▼ 1 (4.3)
22 (95.7)3 (10.7)
25 (89.3)0.10# >0.05 空气支气管征 有
无5(20.0)
20 (80.0)4 (8.2)
45 (91.8)1.20# >0.05 4(17.4)
19 (82.6)5 (17.9)
23 (82.1)0.11# >0.05 周围性肺气肿 有
无1 (4.0)
24(96.0)2(4.1)
47(95.9)0.37# >0.05 1(4.3)
22(95.7)3(10.7)
25(89.3)0.10# >0.05 外周纤维化 有
无5(20.0)
20(80.0)19 (38.8)
30(61.2)2.66 >0.05 4 (17.4)
19(82.6)7(25.0)
21(75.0)0.10# >0.05 胸膜牵拉 有
无10(40.0)
15(60.0)33(67.3)
16(32.7)5.09 <0.05 8(34.8)
15(65.2)22(78.6)
6(21.4)10.00 <0.01 胸膜接触 有
无11(44.0)
14(56.0)23(46.9)
26(53.1)0.06 >0.05 13(56.5)
10(43.5)10(35.7)
18(64.3)2.21 >0.05 胸膜增厚 有
无11(44.0)
14(56.0)20(40.8)
29(59.2)0.07 >0.05 7(30.4)
16(69.6)12(42.9)
16(57.1)0.83 >0.05 胸腔积液 有
无4(16.0)
21(84.0)11(22.4)
38(77.6)0.43 >0.05 5(21.7)
18(78.3)7(25.0)
21(75.0)0.07 >0.05 肺门/纵隔淋巴肿大 有
无10(40.0)
15(60.0)13(26.5)
36(73.5)1.40 >0.05 8(34.8)
15(65.2)11(39.3)
17(60.7)0.11 >0.05 *示t值;△示Z值;#示矫正χ2值;▼示确切概率法 表 1 肺腺癌病人的临床因素与CT征象统计[n; 构成比(%)]
-
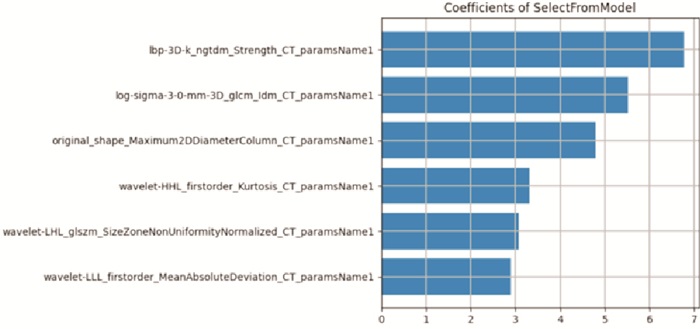
共提取936个影像组学特征,经降维最终选取了6个与EGFR突变显著相关的影像组学特征,将其按照权重系数由高到低排列(见图 3)。

图 3 所筛选出的影像组学特征
-
临床模型由吸烟史、毛刺征、GGO及胸膜牵拉构成;影像组学模型由提取的6个影像组学特征构成;联合模型由吸烟史、毛刺征、磨玻璃密度、胸膜牵拉以及6个影像组学特征构成。联合模型在训练组和验证组中的AUC均高于影像组学模型和临床模型(见表 2),联合模型比影像组学模型和临床模型具有更高的预测效能(见图 4)。
模型 AUC(95%CI) 训练组 验证组 临床模型 0.749(0.653~0.843) 0.753(0.612~0.863) 影像组学模型 0.818(0.711~0.898) 0.797(0.661~0.896) 联合模型 0.860(0.760~0.930) 0.855(0.728~0.938) 表 2 3种模型在训练组和验证组中的AUC

图 4 3种模型的ROC
-
本研究旨在探究影像组学结合临床对肺腺癌EGFR突变状态的预测效能。本次研究共纳入6个影像组学特征对肺腺癌EGFR的突变状态进行预测,在训练组和验证组中的AUC分别达到了0.818和0.797,高于临床因素与CT征象的预测效能。当影像组学结合临床因素与CT征象后,其预测效能得到进一步提高,AUC分别达到了0.860与0.855,展示出了较佳的预测能力。ZHANG等[10]的研究也表明影像组学对EGFR的突变状态具有较佳的预测效能,其在训练组与验证组中的AUC分别为0.759、0.770,优于临床变量;当影像组学特征结合临床变量后,其AUC分别提高到0.861、0.872,本研究结果基本与之一致。影像组学是将横断面影像阵列(如CT、MRI、PET-CT)转化为可定量的影像特征,本质上是将图像数据化,进行精准定量分析,大量的影像数据可以实现常规影像学不能达到的医疗数据整合,相比于传统的形态学诊断模式,更为详细、客观与准确,这可能是影像组学模型的预测效能高于临床模型的原因。
峰度作为一阶特征(First order),用于描述感兴趣区域内灰度值分布的陡峭程度。峰度的绝对值数值越大,表示其分布形态的陡缓程度与正态分布的差异度越大[11]。本次研究发现,肺腺癌EGFR突变型与野生型的峰度有较为显著的差异,这与DIGUMARTHY等[12]的研究基本一致。此外,一项研究报告[13]表明,峰度还可以作为肿瘤血管生成的替代标志物,有助于预测和评估EGFR突变型腺癌病人抗血管生成治疗的反应。归一化尺度区域不均匀性(size zone non-uniformity normalized,SZNN)是灰度区域大小矩阵(gray level size zone matrix,GLSZM)特征,为高阶纹理特征,是衡量整个图像大小区域体积可变性的度量[14]。在一项对298例病人的研究[15]中,研究者从病灶平扫CT的VOI中提取影像组学特征,并进行逻辑回归分析,发现SZNN是EGFR突变的危险因素,本研究结果与之一致。在我们的分析中,基于CT图像的肿瘤最大直径并不是EGFR突变的显著预测因子,而基于影像组学的最大2D直径(列)(Maximum 2D diameter Column)却与EGFR突变状态相关,我们认为,这种差异可以部分地由以下事实来解释:CT上评估肿瘤直径是在横断位最大层面上手工测量的,并且限于肿瘤的一个维度,而基于尺寸的影像组学特征则考虑了整个肿瘤。本次研究发现EGFR突变型与野生型肺腺癌病人在吸烟史、GGO、胸膜牵拉方面存在显著差异。先前研究[16-17]表明无吸烟史、GGO以及胸膜牵拉是EGFR突变阳性的独立预测因子,DANG等[18]的研究同样验证了该结果。WANG等[19]发现EGFR突变型肺腺癌病人的GGO体积百分比明显高于野生型病人,这一结果可能与EGFR突变在贴壁为主型腺癌中更常见有关,其在CT上通常表现为GGO为主的结节[20]。此前也有研究[21]表明EGFR突变状态和GGO无关,产生分歧的原因可能是样本量选择存在偏差所致。研究者为了避免病灶血管管腔内高浓度造影剂对病灶产生硬化伪影干扰,遮盖病灶纹理特征,故选取平扫CT图像进行研究。
本研究存在几点不足之处:(1)样本量小;(2)病灶VOI是由放射科医生手动分割完成,一定程度上受到观察者主观意识的影响,特别是在肿瘤具有GGO成分和短毛刺的情况下,它们的边缘通常与邻近正常的肺实质分界不清,难免产生分割误差;(3)本研究为回顾性研究,存在一定偏倚。
总之,我们的研究发现肺腺癌EGFR突变状态与某些影像组学特征之间存在一定的相关性,影像组学特征有望成为鉴别EGFR突变的潜在替代生物标记物,这些特征结合临床因素与CT征象后可以前瞻性地预测肺腺癌的EGFR突变状态,为EGFR突变病人的临床精准治疗提供支持。
CT影像组学联合临床特征在预测肺腺癌EGFR突变中的价值
Value of the CT radiomics combined with clinical features in the prediction of EGFR mutation in lung adenocarcinoma
-
摘要:
目的探究CT影像组学联合临床特征对肺腺癌EGFR突变状态的预测效能。 方法对125例肺腺癌病人进行回顾性研究,分成训练组(n=74)与验证组(n=51),基于CT成像提取影像组学特征;采用支持向量机(SVM)分类器,分别构建临床模型、影像组学模型以及联合模型;受试者工作特征曲线(ROC)及曲线下面积(AUC)用于评价模型的预测效能。 结果临床模型、影像组学模型以及联合模型在训练组中的AUC分别为0.749(0.653~0.843)、0.818(0.711~0.898)、0.860(0.760~0.930),在验证组中的AUC分别为0.753(0.612~0.863)、0.797(0.661~0.896)、0.855(0.728~0.938)。 结论对于肺腺癌EGFR突变状态的预测,CT影像组学特征优于临床因素与CT征象,当影像组学结合临床因素与CT征象,能进一步提高预测效能。 -
关键词:
- 肺腺癌 /
- 表皮生长因子受体突变 /
- 影像组学
Abstract:ObjectiveTo explore the predictive efficacy of CT radiomics combined with clinical features in predicting EGFR mutation in lung adenocarcinoma. MethodsThe clinical data of 125 patients with lung adenocarcinoma were retrospectively analyzed, the patients were divided into the training group(n=74) and verification group(n=51).The radiomics features were extracted based on CT radiomics.The support vector machine(SVM) classifier was used to construct the clinical model, radiomics model and joint model, respectively.The receiver operating characteristic curve(ROC) and area under the curve(AUC) were used to evaluate the predictive efficacy of model. ResultsThe AUC of clinical model, radiomics model and joint model in training group were 0.749(0.653-0.843), 0.818(0.711-0.898) and 0.860(0.760-0.930), respectively.The AUC of clinical model, radiomics model and joint model in verification group were 0.753(0.612-0.863), 0.797(0.661-0.896) and 0.855(0.728-0.938), respectively. ConclusionsFor the prediction of EGFR mutation status in lung adenocarcinoma, the CT radiomics features are superior to clinical factors and CT signs.The radiomics combined with clinical factors and CT signs can further improve the prediction efficiency. -
表 1 肺腺癌病人的临床因素与CT征象统计[n; 构成比(%)]
项目 训练组 验证组 EGFR(-)(n=25) EGFR(+)(n=49) χ2 P EGFR(-)(n=23) EGFR(+)(n=28) χ2 P 年龄/岁 63.24±12.89 60.47±8.27 0.98* >0.05 63.21±10.31 62.75±9.39 0.17* >0.05 性别 男
女12 (48.0)
13 (52.0)18 (36.7)
31 (63.3)0.87 >0.05 15 (65.2)
8 (34.8)6 (21.4)
22 (78.6)10.00# <0.01 吸烟史 有
无5 (20.0)
20 (80.0)23 (46.9)
26 (53.1)5.11 <0.05 5 (21.7)
18 (78.3)15 (53.6)
13 (46.4)5.36 <0.05 大小/cm 2.80(1.35-5.40) 3.00(2.10-4.00) 0.532△ >0.05 3.27±1.85 3.34±1.67 0.14* >0.05 形态 规则
不规则16 (64.0)
9 (36.0)26 (53.1)
23 (46.9)0.81 >0.05 7 (30.4)
16 (69.6)14 (50.0)
14 (50.0)2.00 >0.05 边界 清晰
模糊24 (96.0)
1 (4.0)42 (85.7)
7 (14.3)0.91# >0.05 4 (17.4)
19 (82.6)1(3.6)
27 (96.4)1.39 >0.05 分叶征 有
无18 (72.0)
7 (28.0)41 (83.7)
8 (16.3)1.40 >0.05 18(78.3)
5 (21.7)23 (82.1)
5 (17.9)0.01 >0.05 毛刺征 有
无7 (28.0)
18 (72.0)26 (53.1)
23 (46.9)4.21 <0.05 7 (30.4)
16(69.6)17 (60.7)
11 (39.3)4.65 <0.05 病灶密度 磨玻璃
实性13 (52.0)
12 (48.0)12 (24.5)
37 (75.5)5.60 <0.05 14 (60.9)
9 (39.1)7 (25.0)
21 (75.0)6.71 <0.01 晕征 有
无5 (20.0)
20 (80.0)14 (28.6)
35 (71.4)0.64 >0.05 10 (43.5)
13 (56.5)8 (28.6)
20 (71.4)1.23 >0.05 钙化 有
无3 (12.0)
22 (88.0)12 (24.5)
37 (75.5)1.60 >0.05 2 (8.7)
21 (91.3)5 (17.9)
23 (82.1)0.29# >0.05 瘤内坏死 有
无4 (16.0)
21 (84.0)15 (30.6)
34 (69.4)1.17 >0.05 6 (26.1)
17 (73.9)6 (21.4)
22 (78.6)0.15 >0.05 空泡征 有
无6 (24.0)
19 (76.0)12 (24.5)
37 (75.5)0.00 >0.05 4 (17.4)
19 (82.6)5 (17.9)
23 (82.1)0.11# >0.05 空洞征 有
无1 (4.0)
24 (96.0)1 (2.0)
48 (98.0)— 1.00▼ 1 (4.3)
22 (95.7)3 (10.7)
25 (89.3)0.10# >0.05 空气支气管征 有
无5(20.0)
20 (80.0)4 (8.2)
45 (91.8)1.20# >0.05 4(17.4)
19 (82.6)5 (17.9)
23 (82.1)0.11# >0.05 周围性肺气肿 有
无1 (4.0)
24(96.0)2(4.1)
47(95.9)0.37# >0.05 1(4.3)
22(95.7)3(10.7)
25(89.3)0.10# >0.05 外周纤维化 有
无5(20.0)
20(80.0)19 (38.8)
30(61.2)2.66 >0.05 4 (17.4)
19(82.6)7(25.0)
21(75.0)0.10# >0.05 胸膜牵拉 有
无10(40.0)
15(60.0)33(67.3)
16(32.7)5.09 <0.05 8(34.8)
15(65.2)22(78.6)
6(21.4)10.00 <0.01 胸膜接触 有
无11(44.0)
14(56.0)23(46.9)
26(53.1)0.06 >0.05 13(56.5)
10(43.5)10(35.7)
18(64.3)2.21 >0.05 胸膜增厚 有
无11(44.0)
14(56.0)20(40.8)
29(59.2)0.07 >0.05 7(30.4)
16(69.6)12(42.9)
16(57.1)0.83 >0.05 胸腔积液 有
无4(16.0)
21(84.0)11(22.4)
38(77.6)0.43 >0.05 5(21.7)
18(78.3)7(25.0)
21(75.0)0.07 >0.05 肺门/纵隔淋巴肿大 有
无10(40.0)
15(60.0)13(26.5)
36(73.5)1.40 >0.05 8(34.8)
15(65.2)11(39.3)
17(60.7)0.11 >0.05 *示t值;△示Z值;#示矫正χ2值;▼示确切概率法  下载: 导出CSV
表 2 3种模型在训练组和验证组中的AUC
模型 AUC(95%CI) 训练组 验证组 临床模型 0.749(0.653~0.843) 0.753(0.612~0.863) 影像组学模型 0.818(0.711~0.898) 0.797(0.661~0.896) 联合模型 0.860(0.760~0.930) 0.855(0.728~0.938)
下载: 导出CSV
-
[1] SIEGELl RL, MILLER KD, JEMAL A. Cancer statistics, 2018[J]. CA Cancer J Clin, 2018, 68(1): 7. doi: 10.3322/caac.21442 [2] JIA Y, YUN CH, PARK E, et al. Overcoming EGFR(T790M) and EGFR(C797S) resistance with mutant-selective allosteric inhibitors[J]. Nature, 2016, 534(7605): 129. doi: 10.1038/nature17960 [3] ETTINGER DS, WOOD DE, AISNER DL, et al. Non-small cell lung cancer, version 5.2017, NCCN clinical guidelines in Oncology[J]. J Natl Compr Canc Netw, 2017, 15(4): 504. doi: 10.6004/jnccn.2017.0050 [4] RIELY GJ, PAO W, PHAM D, et al. Clinical course of patients with non-small cell lung cancer and epidermal growth factor receptor exon 19 and exon 21 mutations treated with gefitinib or erlotinib[J]. Clin Cancer Res, 2006, 12(3): 839. doi: 10.1158/1078-0432.CCR-05-1846 [5] SORIA JC, OHE Y, VANSTEENKISTE J, et al. Osimertinib in untreated EGFR-Mutated advanced non-small-cell lung cancer[J]. N Engl J Med, 2018, 378(2): 113. doi: 10.1056/NEJMoa1713137 [6] LOUGHRAN CF, KEELING CR. Seeding of tumour cells following breast biopsy: a literature review[J]. Br J Radiol, 2011, 84(1006): 869. doi: 10.1259/bjr/77245199 [7] LEE G, LEE HY, PARK H, et al. Radiomics and its emerging role in lung cancer research, imaging biomarkers and clinical management: State of the art[J]. Eur J Radiol, 2017, 86(16): 297. [8] 张静, 武志峰, 鄂林宁. 肺结节(≤ 2 cm)及其周围组织的影像组学特征在其良恶性鉴别中的价值[J]. 中国临床医学影像杂志, 2020, 31(7): 478. [9] 单文莉, 柏根基, 孔丹, 等. 基于常规CT图像应用影像组学模型预测浸润性肺腺癌不同分化程度的价值[J]. 临床放射学杂志, 2020, 39(6): 1095. [10] ZHANG L, CHEN B, LIU X, et al. Quantitative biomarkers for prediction of epidermal growth factor receptor mutation in non-small cell lung cancer[J]. Transl Oncol, 2018, 11(1): 94. doi: 10.1016/j.tranon.2017.10.012 [11] LIU G, XU Z, GE Y, et al. 3D radiomics predicts EGFR mutation, exon-19 deletion and exon-21 L858R mutation in lung adenocarcinoma[J]. Transl Lung Cancer Res, 2020, 9(4): 1212. doi: 10.21037/tlcr-20-122 [12] DIGUMARTHY SR, PADOLE AM, GULLO RL, et al. Can CT radiomic analysis in NSCLC predict histology and EGFR mutation status?[J]. Medicine, 2019, 98(1): e13963. doi: 10.1097/MD.0000000000013963 [13] GOH V, GANESHAN B, NATHAN P, et al. Assessment of response to tyrosine kinase inhibitors in metastatic renal cell cancer: CT texture as a predictive biomarker[J]. Radiology, 2011, 261(1): 165. doi: 10.1148/radiol.11110264 [14] LIU Q, SUN D, LI N, et al. Predicting EGFR mutation subtypes in lung adenocarcinoma using 18F-FDG PET/CT radiomic features[J]. Transl Lung Cancer Res, 2020, 9(3): 549. doi: 10.21037/tlcr.2020.04.17 [15] MEI D, LUO Y, WANG Y, et al. CT texture analysis of lung adenocarcinoma: can Radiomic features be surrogate biomarkers for EGFR mutation statuses[J]. Cancer Imaging, 2018, 18(1): 52. doi: 10.1186/s40644-018-0184-2 [16] RIZZO S, RAIMONDI S, DE JONG EEC, et al. Genomics of non-small cell lung cancer(NSCLC): association between CT-based imaging features and EGFR and K-RAS mutations in 122 patients-An external validation[J]. Eur J Radiol, 2019, 110(1): 148. [17] LIU Y, KIM J, BALAGURUNATHAN Y, et al. Radiomic features are associated with EGFR mutation status in lung adenocarcinomas[J]. Clin Lung Cancer, 2016, 17(5): 441. doi: 10.1016/j.cllc.2016.02.001 [18] DANG Y, WANG R, QIAN K, et al. Clinical and radiological predictors of epidermal growth factor receptor mutation in nonsmall cell lung cancer[J]. J Appl Clin Med Phys, 2021, 22(1): 271. doi: 10.1002/acm2.13107 [19] WANG H, GUO H, WANG Z, et al. The diagnostic value of quantitative CT analysis of ground-glass volume percentage in differentiating epidermal growth factor receptor mutation and subtypes in lung adenocarcinoma[J]. Biomed Res Int, 20192019: 1. [20] LEE HJ, KIM YT, KANG CH, et al. Epidermal growth factor receptor mutation in lung adenocarcinomas: relationship with CT characteristics and histologic subtypes[J]. Radiology, 2013, 268(1): 254. doi: 10.1148/radiol.13112553 [21] SUGANO M, SHUMIZU K, NAKANO T, et al. Correlation between computed tomography findings and epidermal growth factor receptor and KRAS gene mutations in patients with pulmonary adenocarcinoma[J]. Oncol Rep, 2011, 26(5): 1205. -

 点击查看大图
图(4)表(2)
计量
- 文章访问数: 4263
- HTML全文浏览量: 2446
- PDF下载量: 35
- 被引次数: 0
